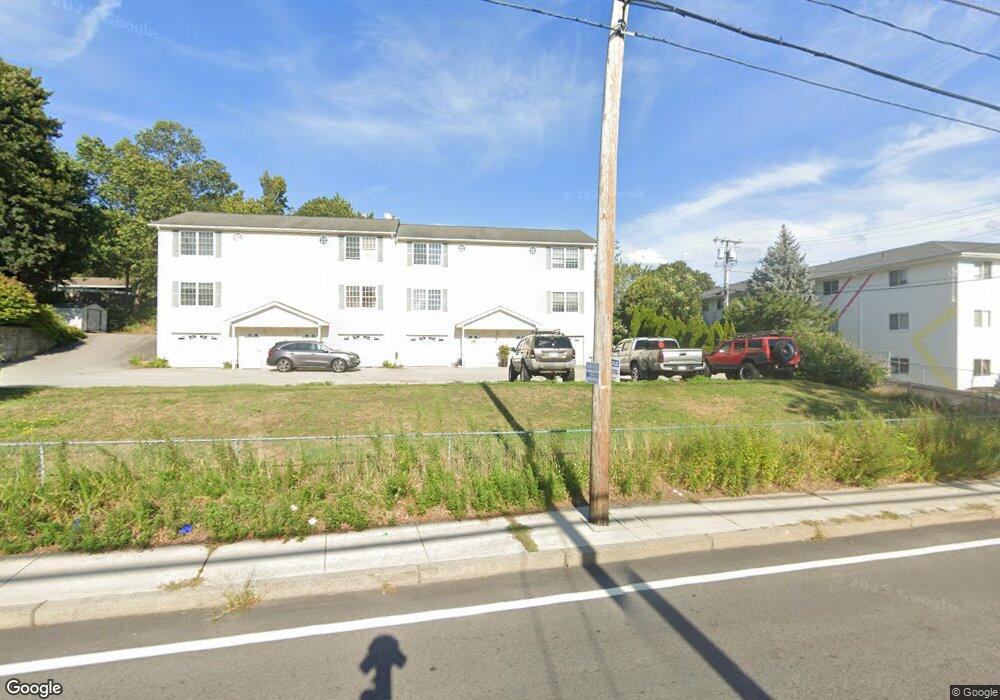
377 Woonasquatucket Ave Unit 3 North Providence, RI 02911
Allendale-Lymansville NeighborhoodEstimated Value: $244,000 - $326,000
--
Bed
2
Baths
1,134
Sq Ft
$263/Sq Ft
Est. Value
About This Home
This home is located at 377 Woonasquatucket Ave Unit 3, North Providence, RI 02911 and is currently estimated at $298,059, approximately $262 per square foot. 377 Woonasquatucket Ave Unit 3 is a home located in Providence County with nearby schools including North Providence High School, St. Thomas Regional School, and St. Augustine School.
Ownership History
Date
Name
Owned For
Owner Type
Purchase Details
Closed on
May 17, 2024
Sold by
North Providence Town Of
Bought by
S W Hldg Llc
Current Estimated Value
Purchase Details
Closed on
Oct 23, 2015
Sold by
Rahi Real Estate Holdi
Bought by
Rescap Securities Holding
Purchase Details
Closed on
Feb 23, 2015
Sold by
Residential Funding Co
Bought by
Rahi Real Estate Holdi
Purchase Details
Closed on
Apr 11, 2014
Sold by
Bailey Calvin C
Bought by
Reisidential Funding C
Purchase Details
Closed on
Jul 31, 2006
Sold by
Adp Assoc
Bought by
Bailey Calvin C
Home Financials for this Owner
Home Financials are based on the most recent Mortgage that was taken out on this home.
Original Mortgage
$183,200
Interest Rate
6.67%
Mortgage Type
Purchase Money Mortgage
Create a Home Valuation Report for This Property
The Home Valuation Report is an in-depth analysis detailing your home's value as well as a comparison with similar homes in the area
Home Values in the Area
Average Home Value in this Area
Purchase History
| Date | Buyer | Sale Price | Title Company |
|---|---|---|---|
| S W Hldg Llc | $6,091 | None Available | |
| S W Hldg Llc | $6,091 | None Available | |
| Rescap Securities Holding | -- | -- | |
| Gansallo Victoria | $110,000 | -- | |
| Rescap Securities Holding | -- | -- | |
| Rahi Real Estate Holdi | -- | -- | |
| Rahi Real Estate Holdi | -- | -- | |
| Reisidential Funding C | $113,300 | -- | |
| Reisidential Funding C | $113,300 | -- | |
| Bailey Calvin C | $229,000 | -- | |
| Bailey Calvin C | $229,000 | -- |
Source: Public Records
Mortgage History
| Date | Status | Borrower | Loan Amount |
|---|---|---|---|
| Previous Owner | Bailey Calvin C | $183,200 |
Source: Public Records
Tax History Compared to Growth
Tax History
| Year | Tax Paid | Tax Assessment Tax Assessment Total Assessment is a certain percentage of the fair market value that is determined by local assessors to be the total taxable value of land and additions on the property. | Land | Improvement |
|---|---|---|---|---|
| 2024 | $3,349 | $201,600 | $0 | $201,600 |
| 2023 | $3,349 | $201,600 | $0 | $201,600 |
| 2022 | $3,816 | $167,300 | $0 | $167,300 |
| 2021 | $3,816 | $167,300 | $0 | $167,300 |
| 2020 | $3,816 | $167,300 | $0 | $167,300 |
| 2017 | $4,083 | $156,200 | $0 | $156,200 |
| 2016 | $4,194 | $150,100 | $0 | $150,100 |
| 2015 | $4,194 | $150,100 | $0 | $150,100 |
| 2014 | $4,194 | $150,100 | $0 | $150,100 |
Source: Public Records
Map
Nearby Homes
- 19 Warren Ave Unit 3
- 30 Intervale Ave
- 10 Sadler St
- 32 Orchard St
- 11 Glen St
- 494 Woonasquatucket Ave Unit 107
- 494 Woonasquatucket Ave Unit 407
- 494 Woonasquatucket Ave Unit 208
- 33 Swan St
- 4 Hatherly St
- 37 Atlantic Blvd
- 24 Iris Ln
- 5 Pezzi St
- 2 Simpson St
- 136 George Waterman Rd
- 578 Woonasquatucket Ave
- 91 East Ave
- 22 Whipple Ave
- 1854 Smith St
- 11 Bowen St
- 377 Woonasquatucket Ave Unit 4
- 377 Woonasquatucket Ave Unit 2
- 377 Woonasquatucket Ave
- 377 Woonasquatucket Ave Unit A
- 377 Woonasquatucket Ave Unit C
- 385 Woonasquatucket Ave
- 1 Intervale Ave
- 0 Intervale Ave
- 380 Woonasquatucket Ave
- 380 Woonasquatucket Ave Unit Second Floor
- 380 Woonasquatucket Ave Unit 2
- 367 Woonasquatucket Ave
- 367 Woonasquatucket Ave Unit 10
- 367 Woonasquatucket Ave Unit 9
- 393 Woonasquatucket Ave
- 391 Woonasquatucket Ave
- 374 Woonasquatucket Ave
- 374 Woonasquatucket Ave Unit B
- 15 Victor St
- 14 Warren Ave