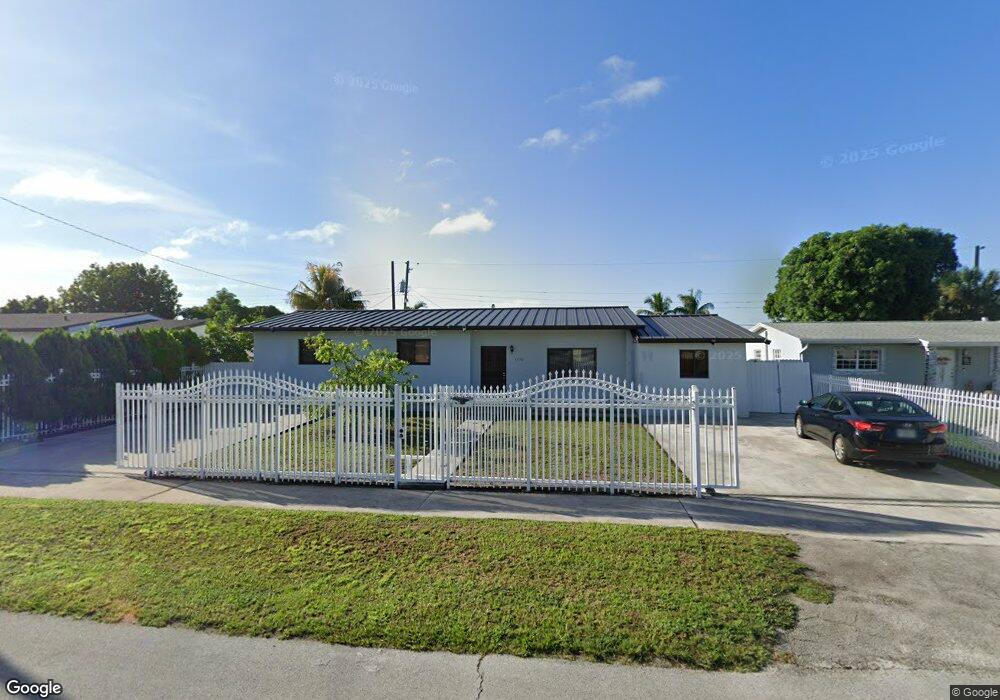
3770 NW 171 Terrace Miami Gardens, FL 33055
Carol City NeighborhoodEstimated Value: $494,000 - $589,390
3
Beds
3
Baths
1,570
Sq Ft
$355/Sq Ft
Est. Value
About This Home
This home is located at 3770 NW 171 Terrace, Miami Gardens, FL 33055 and is currently estimated at $556,598, approximately $354 per square foot. 3770 NW 171 Terrace is a home located in Miami-Dade County with nearby schools including Carol City Elementary School, Carol City Middle School, and Miami Carol City Senior High School.
Ownership History
Date
Name
Owned For
Owner Type
Purchase Details
Closed on
Feb 9, 2024
Sold by
Anido Yaikel and Anido Alberto
Bought by
Garcia Alberto and Anido Yaikel
Current Estimated Value
Purchase Details
Closed on
Jun 10, 2016
Sold by
Lemus Cristobal and Lemus Nayra
Bought by
Anido Yaikel
Home Financials for this Owner
Home Financials are based on the most recent Mortgage that was taken out on this home.
Original Mortgage
$223,870
Interest Rate
3.62%
Mortgage Type
FHA
Purchase Details
Closed on
Oct 3, 2014
Sold by
Investments Lawyers Llc
Bought by
Lemus Nayra
Purchase Details
Closed on
Jun 16, 2014
Sold by
Elmore Patrice M and Lewis Sharon V
Bought by
Investment Lawyers Llc
Purchase Details
Closed on
Jul 25, 2008
Sold by
Lewis Jeanette and Lewis Charles Wang
Bought by
Lewis Jeanette and Elmore Patrice M
Create a Home Valuation Report for This Property
The Home Valuation Report is an in-depth analysis detailing your home's value as well as a comparison with similar homes in the area
Home Values in the Area
Average Home Value in this Area
Purchase History
| Date | Buyer | Sale Price | Title Company |
|---|---|---|---|
| Garcia Alberto | -- | None Listed On Document | |
| Anido Yaikel | $228,000 | Attorney | |
| Lemus Nayra | $175,000 | Attorney | |
| Investment Lawyers Llc | $110,000 | Firm Title Corporation | |
| Lewis Jeanette | -- | Attorney |
Source: Public Records
Mortgage History
| Date | Status | Borrower | Loan Amount |
|---|---|---|---|
| Previous Owner | Anido Yaikel | $223,870 |
Source: Public Records
Tax History Compared to Growth
Tax History
| Year | Tax Paid | Tax Assessment Tax Assessment Total Assessment is a certain percentage of the fair market value that is determined by local assessors to be the total taxable value of land and additions on the property. | Land | Improvement |
|---|---|---|---|---|
| 2025 | $5,930 | $279,116 | -- | -- |
| 2024 | $5,545 | $271,250 | -- | -- |
| 2023 | $5,545 | $258,391 | $0 | $0 |
| 2022 | $5,348 | $250,866 | $0 | $0 |
| 2021 | $5,281 | $243,560 | $0 | $0 |
| 2020 | $5,225 | $240,198 | $0 | $0 |
| 2019 | $5,129 | $234,798 | $0 | $0 |
| 2018 | $4,930 | $230,421 | $79,773 | $150,648 |
| 2017 | $5,322 | $199,204 | $0 | $0 |
| 2016 | $3,436 | $163,740 | $0 | $0 |
| 2015 | $4,001 | $142,404 | $0 | $0 |
| 2014 | $2,016 | $102,042 | $0 | $0 |
Source: Public Records
Map
Nearby Homes
- 3745 NW 171st Terrace
- 17025 NW 38th Ct
- 3851 NW 172nd Terrace
- 3750 NW 174th St
- 17201 NW 37th Ave
- 3811 NW 174th St
- 3610 NW 171st St
- 3521 NW 171st Terrace
- 16815 NW 38th Ct
- 16855 NW 37th Ave
- 3960 NW 174th St
- 3861 NW 177th St
- 16911 NW 34th Ave
- 3311 NW 171st St
- 3880 NW 179th St
- 3301 NW 174th St
- 16350 NW 37th Ave
- 17211 NW 43rd Ave
- 3260 NW 174th St
- 4260 NW 169th Terrace
- 3770 NW 171st Terrace
- 3800 NW 171st Terrace
- 3760 NW 171st Terrace
- 3771 NW 171st St
- 3801 NW 171st St
- 3810 NW 171st Terrace
- 3775 NW 171st Terrace
- 3761 NW 171st St
- 3805 NW 171st Terrace
- 3765 NW 171st Terrace
- 3805 NW 171 Terrace
- 3750 NW 171st Terrace
- 3811 NW 171st St
- 3751 NW 171st St
- 3755 NW 171st Terrace
- 3815 NW 171st Terrace
- 3820 NW 171st Terrace
- 3821 NW 171st St
- 3770 NW 172nd Terrace
- 3740 NW 171st Terrace