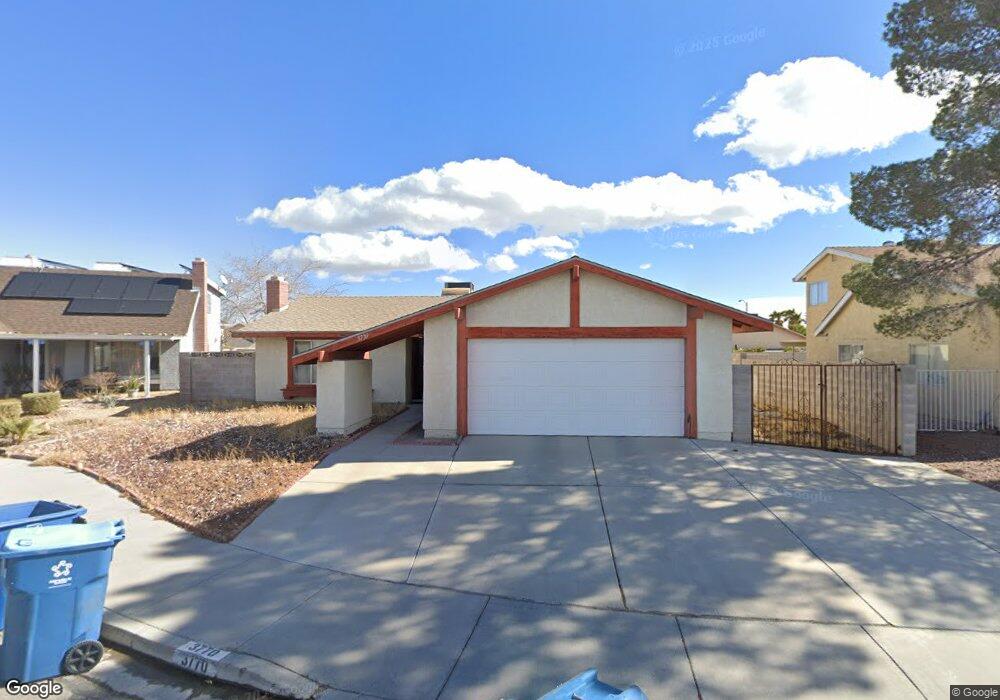
3770 Reflection Way Las Vegas, NV 89147
Estimated Value: $371,083 - $410,000
4
Beds
2
Baths
1,337
Sq Ft
$297/Sq Ft
Est. Value
About This Home
This home is located at 3770 Reflection Way, Las Vegas, NV 89147 and is currently estimated at $397,021, approximately $296 per square foot. 3770 Reflection Way is a home located in Clark County with nearby schools including Pat Diskin Elementary School, Clifford J Lawrence Junior High School, and Spring Valley High School.
Ownership History
Date
Name
Owned For
Owner Type
Purchase Details
Closed on
Sep 1, 2004
Sold by
Storey Billy David and Storey Constance J
Bought by
Chau Mabel Nghi
Current Estimated Value
Home Financials for this Owner
Home Financials are based on the most recent Mortgage that was taken out on this home.
Original Mortgage
$191,200
Outstanding Balance
$89,888
Interest Rate
5.12%
Mortgage Type
New Conventional
Estimated Equity
$307,133
Purchase Details
Closed on
May 1, 2001
Sold by
Storey B David and Storey Connie
Bought by
Storey Billy David and Storey Constance J
Purchase Details
Closed on
Jul 18, 2000
Sold by
Lentz Frank George and Lentz Gloria
Bought by
Storey B David and Storey Connie
Home Financials for this Owner
Home Financials are based on the most recent Mortgage that was taken out on this home.
Original Mortgage
$95,100
Interest Rate
8.15%
Create a Home Valuation Report for This Property
The Home Valuation Report is an in-depth analysis detailing your home's value as well as a comparison with similar homes in the area
Home Values in the Area
Average Home Value in this Area
Purchase History
| Date | Buyer | Sale Price | Title Company |
|---|---|---|---|
| Chau Mabel Nghi | $239,000 | Old Republic Title Co Of Nv | |
| Storey Billy David | -- | -- | |
| Storey B David | $118,900 | Old Republic Title Company |
Source: Public Records
Mortgage History
| Date | Status | Borrower | Loan Amount |
|---|---|---|---|
| Open | Chau Mabel Nghi | $191,200 | |
| Previous Owner | Storey B David | $95,100 | |
| Closed | Chau Mabel Nghi | $23,900 |
Source: Public Records
Tax History Compared to Growth
Tax History
| Year | Tax Paid | Tax Assessment Tax Assessment Total Assessment is a certain percentage of the fair market value that is determined by local assessors to be the total taxable value of land and additions on the property. | Land | Improvement |
|---|---|---|---|---|
| 2025 | $1,480 | $61,561 | $35,350 | $26,211 |
| 2024 | $1,371 | $61,561 | $35,350 | $26,211 |
| 2023 | $913 | $60,927 | $35,000 | $25,927 |
| 2022 | $1,269 | $51,540 | $27,300 | $24,240 |
| 2021 | $1,176 | $46,934 | $23,450 | $23,484 |
| 2020 | $1,089 | $47,171 | $23,450 | $23,721 |
| 2019 | $1,020 | $44,780 | $21,000 | $23,780 |
| 2018 | $974 | $42,516 | $19,250 | $23,266 |
| 2017 | $1,215 | $41,441 | $17,500 | $23,941 |
| 2016 | $913 | $37,243 | $12,600 | $24,643 |
| 2015 | $910 | $35,179 | $10,500 | $24,679 |
| 2014 | $881 | $29,155 | $8,050 | $21,105 |
Source: Public Records
Map
Nearby Homes
- 7231 Sequoia Springs Dr
- 7150 Mountain Moss Dr
- 7072 Parasol Ln
- 6999 Mountain Moss Dr
- 3974 Round Wood St
- 6979 Stober Ct
- 3869 Spruceview Ct
- 7137 Flowering Rose Ave
- 7015 Quarry Dr
- 7300 Lavender Rose Ave
- 3768 Majestic Dr
- 7245 Blooming Jasmine Ave
- 7253 Blooming Jasmine Ave
- 7311 Spring Flower Ave
- 7225 Bridgeview Ave
- 7246 Spring Flower Ave
- 7166 Purple Iris Ave
- 7400 W Flamingo Rd Unit 1071
- 7400 W Flamingo Rd Unit 2094
- 7400 W Flamingo Rd Unit 2033
- 3780 Reflection Way
- 3760 Reflection Way
- 3767 Prosperity Ln
- 3757 Prosperity Ln
- 3777 Prosperity Ln
- 3790 Reflection Way
- 3750 Reflection Way
- 3769 Reflection Way
- 3747 Prosperity Ln
- 3787 Prosperity Ln
- 3779 Reflection Way
- 3759 Reflection Way
- 3759 Reflection Way Unit House
- 3759 Reflection Way Unit n/a
- 3800 Reflection Way
- 3749 Reflection Way
- 3789 Reflection Way
- 3737 Prosperity Ln
- 3797 Prosperity Ln
- 7241 Mountain Moss Dr