Estimated Value: $207,459 - $240,000
2
Beds
1
Bath
1,020
Sq Ft
$218/Sq Ft
Est. Value
About This Home
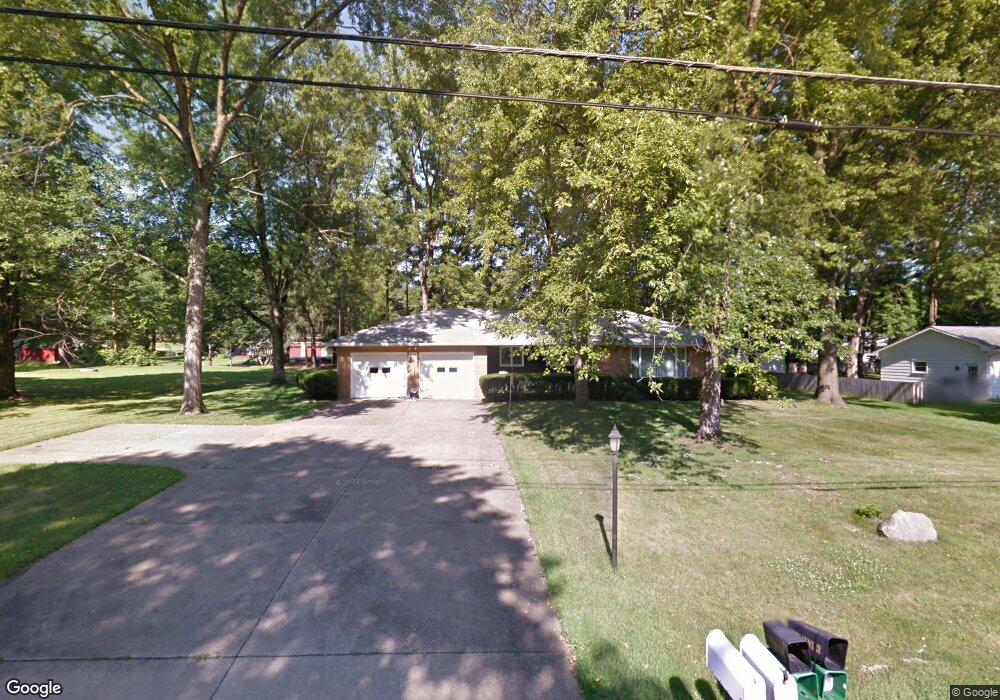
This home is located at 3772 Kauffman Rd, Stow, OH 44224 and is currently estimated at $222,115, approximately $217 per square foot. 3772 Kauffman Rd is a home located in Summit County with nearby schools including Stow-Munroe Falls High School and Holy Family Elementary School.
Ownership History
Date
Name
Owned For
Owner Type
Purchase Details
Closed on
Oct 3, 2018
Sold by
Stewart James L and Stewart Diane C
Bought by
Mook Corey S and Mook Samantha J
Current Estimated Value
Home Financials for this Owner
Home Financials are based on the most recent Mortgage that was taken out on this home.
Original Mortgage
$137,389
Interest Rate
4.6%
Mortgage Type
VA
Purchase Details
Closed on
Aug 20, 2018
Sold by
Sckulich Pamela J and Audin Kevin
Bought by
Stewart James L and Stewart Dinae C
Home Financials for this Owner
Home Financials are based on the most recent Mortgage that was taken out on this home.
Original Mortgage
$137,389
Interest Rate
4.6%
Mortgage Type
VA
Purchase Details
Closed on
Jul 13, 2018
Sold by
Sekulich Pamela J
Bought by
Sekulich Pamela J and Audin Kevin
Create a Home Valuation Report for This Property
The Home Valuation Report is an in-depth analysis detailing your home's value as well as a comparison with similar homes in the area
Home Values in the Area
Average Home Value in this Area
Purchase History
| Date | Buyer | Sale Price | Title Company |
|---|---|---|---|
| Mook Corey S | $133,000 | Dimond Title Co | |
| Stewart James L | $110,000 | Diamond Title Co | |
| Sekulich Pamela J | -- | None Available |
Source: Public Records
Mortgage History
| Date | Status | Borrower | Loan Amount |
|---|---|---|---|
| Closed | Mook Corey S | $137,389 |
Source: Public Records
Tax History
| Year | Tax Paid | Tax Assessment Tax Assessment Total Assessment is a certain percentage of the fair market value that is determined by local assessors to be the total taxable value of land and additions on the property. | Land | Improvement |
|---|---|---|---|---|
| 2024 | $3,282 | $56,925 | $12,219 | $44,706 |
| 2023 | $3,282 | $56,925 | $12,219 | $44,706 |
| 2022 | $3,052 | $46,659 | $10,014 | $36,645 |
| 2021 | $2,740 | $46,659 | $10,014 | $36,645 |
| 2020 | $2,695 | $46,660 | $10,010 | $36,650 |
| 2019 | $2,484 | $40,070 | $10,850 | $29,220 |
| 2018 | $1,935 | $40,070 | $10,850 | $29,220 |
| 2017 | $1,782 | $40,070 | $10,850 | $29,220 |
| 2016 | $1,804 | $36,630 | $10,850 | $25,780 |
| 2015 | $1,782 | $36,630 | $10,850 | $25,780 |
| 2014 | $1,783 | $36,630 | $10,850 | $25,780 |
| 2013 | $1,997 | $40,420 | $10,850 | $29,570 |
Source: Public Records
Map
Nearby Homes
- 3905 Kent Rd
- 3874 Lake Run Blvd
- 3767 Lake Run Blvd
- 3753 Lake Run Blvd
- 3958 Lake Run Blvd
- 3828 Osage St Unit 3832
- 0 Vira Rd
- 3820 Seneca St
- 0 Pardee Rd
- 3846 Charring Cross Dr
- 4040 Burton Dr
- 3666 Hiwood Ave
- 4003 Kenneth Rd
- 3550 Sanford Ave
- 3679 Sanford Ave
- 3842 Moreland Ave
- 4205 Osage St
- 2365 Norman Dr
- 245 Bermont Ave
- 4544 Fishcreek Rd
- 3786 Kauffman Rd
- 3758 Kauffman Rd
- 3759 Baird Rd
- 3769 Baird Rd
- 3749 Baird Rd
- 3775 Kauffman Rd
- 3763 Kauffman Rd
- 3779 Baird Rd
- 3785 Kauffman Rd
- 3739 Baird Rd
- 3800 Kauffman Rd
- 3744 Kauffman Rd
- 3753 Kauffman Rd
- 3797 Kauffman Rd
- 3729 Baird Rd
- 3760 Baird Rd
- 3750 Baird Rd
- 3770 Baird Rd
- 3814 Kauffman Rd
- 3730 Kauffman Rd
Your Personal Tour Guide
Ask me questions while you tour the home.