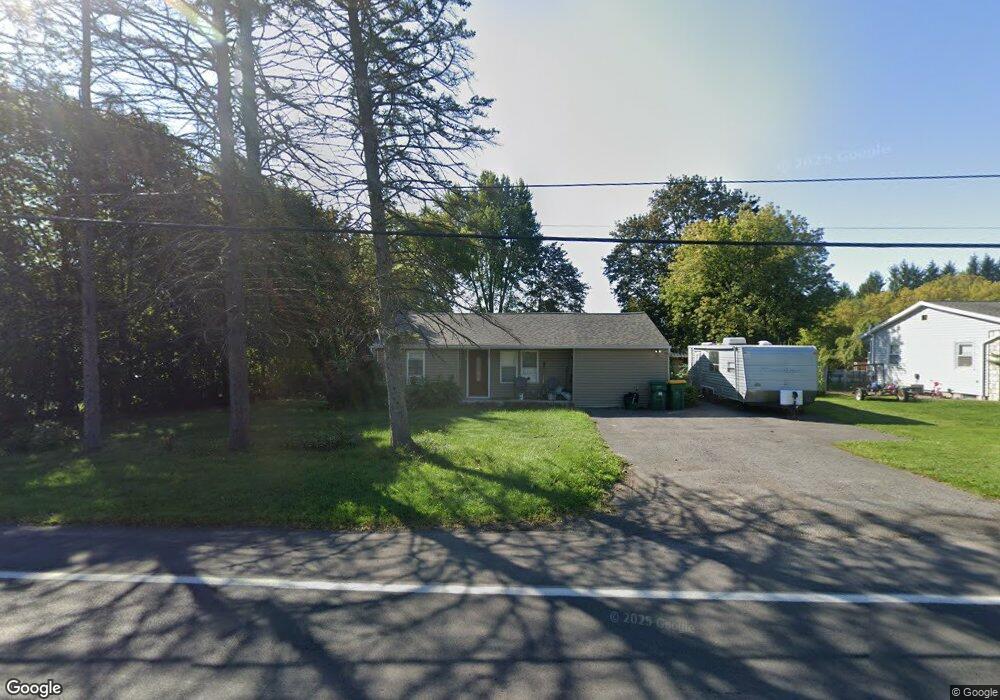
3772 W Seneca Turnpike Syracuse, NY 13215
Estimated Value: $141,000 - $193,000
2
Beds
1
Bath
680
Sq Ft
$248/Sq Ft
Est. Value
About This Home
This home is located at 3772 W Seneca Turnpike, Syracuse, NY 13215 and is currently estimated at $168,395, approximately $247 per square foot. 3772 W Seneca Turnpike is a home located in Onondaga County with nearby schools including K C Heffernan Elementary School, C S Driver Middle School, and Marcellus High School.
Ownership History
Date
Name
Owned For
Owner Type
Purchase Details
Closed on
Nov 23, 2020
Sold by
Keohane Michael and Clere Abbey
Bought by
Markham Jordan E
Current Estimated Value
Home Financials for this Owner
Home Financials are based on the most recent Mortgage that was taken out on this home.
Original Mortgage
$8,000
Outstanding Balance
$7,119
Interest Rate
2.8%
Mortgage Type
Second Mortgage Made To Cover Down Payment
Estimated Equity
$161,276
Purchase Details
Closed on
Jun 30, 2009
Sold by
Scott Enid G
Bought by
Rohe Patrick E
Purchase Details
Closed on
May 28, 2008
Sold by
Puchta Frederick
Bought by
Puchta Scutt Enid and Puchta Martin
Purchase Details
Closed on
Feb 17, 2004
Sold by
Puchta Frederick
Bought by
Puchta Frederick
Purchase Details
Closed on
Jul 12, 2001
Sold by
Mestler Frances B
Bought by
Puchta Frederick Martin
Create a Home Valuation Report for This Property
The Home Valuation Report is an in-depth analysis detailing your home's value as well as a comparison with similar homes in the area
Home Values in the Area
Average Home Value in this Area
Purchase History
| Date | Buyer | Sale Price | Title Company |
|---|---|---|---|
| Markham Jordan E | $90,000 | None Available | |
| Markham Jordan E | $90,000 | None Available | |
| Rohe Patrick E | $59,000 | Jeffrey Davis | |
| Puchta Scutt Enid | -- | -- | |
| Puchta Frederick | -- | -- | |
| Puchta Frederick Martin | $42,000 | George Raus |
Source: Public Records
Mortgage History
| Date | Status | Borrower | Loan Amount |
|---|---|---|---|
| Open | Markham Jordan E | $8,000 | |
| Closed | Markham Jordan E | $8,000 |
Source: Public Records
Tax History Compared to Growth
Tax History
| Year | Tax Paid | Tax Assessment Tax Assessment Total Assessment is a certain percentage of the fair market value that is determined by local assessors to be the total taxable value of land and additions on the property. | Land | Improvement |
|---|---|---|---|---|
| 2024 | $3,266 | $84,500 | $10,000 | $74,500 |
| 2023 | $3,312 | $84,500 | $10,000 | $74,500 |
| 2022 | $3,288 | $84,500 | $10,000 | $74,500 |
| 2021 | $3,169 | $84,500 | $10,000 | $74,500 |
| 2020 | $2,513 | $84,500 | $10,000 | $74,500 |
| 2019 | $1,054 | $84,500 | $10,000 | $74,500 |
| 2018 | $2,467 | $84,500 | $10,000 | $74,500 |
| 2017 | $1,225 | $84,500 | $10,000 | $74,500 |
| 2016 | $2,410 | $84,500 | $10,000 | $74,500 |
| 2015 | -- | $84,500 | $10,000 | $74,500 |
| 2014 | -- | $60,900 | $10,000 | $50,900 |
Source: Public Records
Map
Nearby Homes
- 4350 Chickadee Cir
- 4336 Chickadee Cir
- 4745 Cedarvale Rd
- 4387 Kasson Rd
- 4821 Cedarvale Rd
- 5201 Kasson Rd
- 4000 Cedarvale Rd
- 4811 Beef St
- L26.1 Howlett Hill Rd
- 5025 Kasson Rd
- 4010 Oldwyck Cir
- 0 Howlett Hill Rd Unit 23087687
- 3239 W Seneca Turnpike
- 4043 Howlett Hill Rd
- 4955 Beef St
- 3900 Amber Rd
- 5086 Stagecoach Rd
- 4386 W Seneca Turnpike
- 0 Harris Rd
- L17 Howlett Hill Rd
- 3766 W Seneca Turnpike
- 3773 Dorothy Dr
- 3767 Dorothy Dr
- 3758 W Seneca Turnpike
- 3779 Dorothy Dr
- 4487 Sunset Dr
- 4465 Cedarvale Rd
- 3800 W Seneca Turnpike
- 4477 Sunset Dr
- 3768 Dorothy Dr
- 3774 Dorothy Dr
- 4455 Cedarvale Rd
- 4471 Sunset Dr
- 4464 Sunset Dr
- 4465 Sunset Dr
- 4520 Cedarvale Rd
- 4462 Sunset Dr
- 4528 Cedarvale Rd
- 4447 Cedarvale Rd
- 4459 Sunset Dr