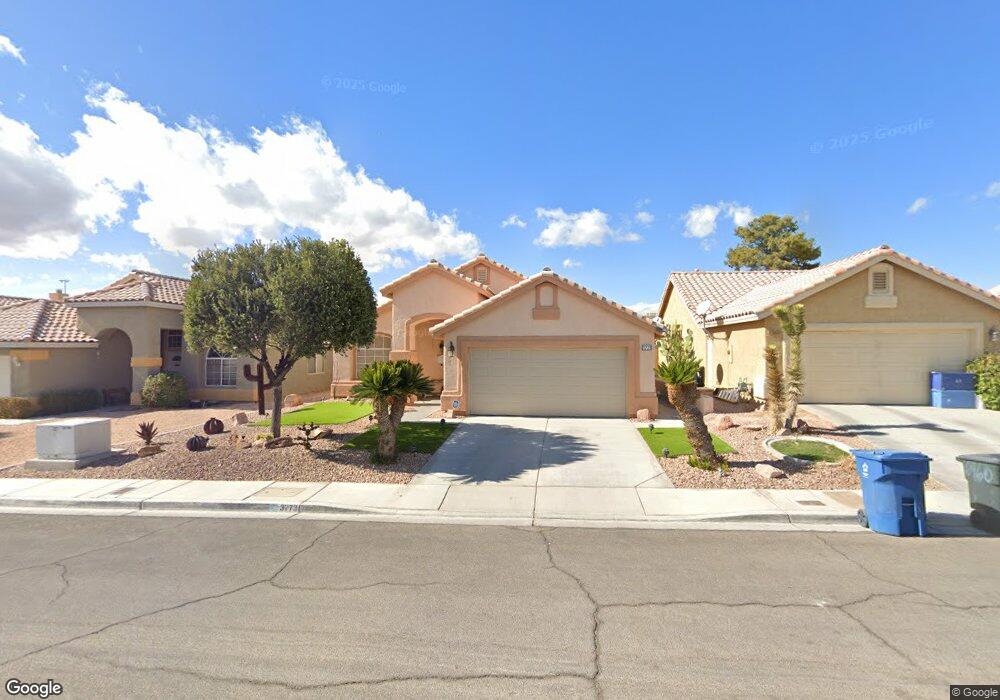
3773 Flowering Peach Ct Las Vegas, NV 89147
Estimated Value: $375,000 - $482,000
3
Beds
2
Baths
1,599
Sq Ft
$275/Sq Ft
Est. Value
About This Home
This home is located at 3773 Flowering Peach Ct, Las Vegas, NV 89147 and is currently estimated at $439,668, approximately $274 per square foot. 3773 Flowering Peach Ct is a home located in Clark County with nearby schools including Pat Diskin Elementary School, Clifford J Lawrence Junior High School, and Spring Valley High School.
Ownership History
Date
Name
Owned For
Owner Type
Purchase Details
Closed on
Feb 12, 2024
Sold by
Ambre Gary
Bought by
Ambre Mickey Lynn
Current Estimated Value
Home Financials for this Owner
Home Financials are based on the most recent Mortgage that was taken out on this home.
Original Mortgage
$136,000
Outstanding Balance
$133,601
Interest Rate
6.62%
Mortgage Type
New Conventional
Estimated Equity
$306,067
Purchase Details
Closed on
Jan 20, 2023
Sold by
Love Living Trust
Bought by
Ambre Mickey Lynn
Purchase Details
Closed on
Apr 24, 1997
Sold by
Love Charles J and Love Rose
Bought by
Love Rosella and Love Charles J
Purchase Details
Closed on
Nov 12, 1993
Sold by
Falcon Homes Inc
Bought by
Love Charles J and Love Rose
Create a Home Valuation Report for This Property
The Home Valuation Report is an in-depth analysis detailing your home's value as well as a comparison with similar homes in the area
Home Values in the Area
Average Home Value in this Area
Purchase History
| Date | Buyer | Sale Price | Title Company |
|---|---|---|---|
| Ambre Mickey Lynn | -- | Landmark Title | |
| Ambre Mickey Lynn | -- | Landmark Title | |
| Ambre Mickey Lynn | $165,000 | -- | |
| Love Rosella | -- | -- | |
| Love Charles J | $120,000 | Nevada Title Company |
Source: Public Records
Mortgage History
| Date | Status | Borrower | Loan Amount |
|---|---|---|---|
| Open | Ambre Mickey Lynn | $136,000 | |
| Closed | Ambre Mickey Lynn | $136,000 |
Source: Public Records
Tax History Compared to Growth
Tax History
| Year | Tax Paid | Tax Assessment Tax Assessment Total Assessment is a certain percentage of the fair market value that is determined by local assessors to be the total taxable value of land and additions on the property. | Land | Improvement |
|---|---|---|---|---|
| 2025 | $2,235 | $102,056 | $35,000 | $67,056 |
| 2024 | $2,071 | $102,056 | $35,000 | $67,056 |
| 2023 | $2,071 | $96,382 | $32,550 | $63,832 |
| 2022 | $1,917 | $85,808 | $26,950 | $58,858 |
| 2021 | $1,776 | $80,961 | $24,850 | $56,111 |
| 2020 | $1,720 | $78,331 | $22,400 | $55,931 |
| 2019 | $1,670 | $75,898 | $20,650 | $55,248 |
| 2018 | $1,622 | $70,346 | $16,800 | $53,546 |
| 2017 | $2,005 | $70,989 | $16,450 | $54,539 |
| 2016 | $1,535 | $67,371 | $12,600 | $54,771 |
| 2015 | $1,532 | $64,264 | $10,500 | $53,764 |
| 2014 | $1,487 | $51,625 | $9,100 | $42,525 |
Source: Public Records
Map
Nearby Homes
- 3869 Spruceview Ct
- 7231 Sequoia Springs Dr
- 3974 Round Wood St
- 3685 Springbud Dr
- 7570 W Flamingo Rd Unit 219
- 7570 W Flamingo Rd Unit 125
- 7150 Mountain Moss Dr
- 7300 Lavender Rose Ave
- 7400 W Flamingo Rd Unit 1071
- 7400 W Flamingo Rd Unit 2094
- 7400 W Flamingo Rd Unit 2033
- 7400 W Flamingo Rd Unit 1033
- 7400 W Flamingo Rd Unit 2013
- 7311 Spring Flower Ave
- 7938 Angel Tree Ct
- 7253 Blooming Jasmine Ave
- 7245 Blooming Jasmine Ave
- 7072 Parasol Ln
- 4121 Satinwood Dr
- 7137 Flowering Rose Ave
- 3779 Flowering Peach Ct
- 3765 Flowering Peach Ct
- 3787 Flowering Peach Ct
- 3755 Flowering Peach Ct
- 3793 Flowering Peach Ct
- 3770 Flowering Peach Ct
- 3778 Flowering Peach Ct
- 3762 Flowering Peach Ct
- 3786 Flowering Peach Ct Unit 2
- 3737 Flowering Peach Ct
- 3752 Flowering Peach Ct
- 3792 Flowering Peach Ct
- 3742 Flowering Peach Ct
- 3729 Flowering Peach Ct
- 3769 Yellow Jasmine Dr
- 3777 Yellow Jasmine Dr
- 3761 Yellow Jasmine Dr
- 3805 Willowview Ct
- 3785 Yellow Jasmine Dr
- 3732 Flowering Peach Ct