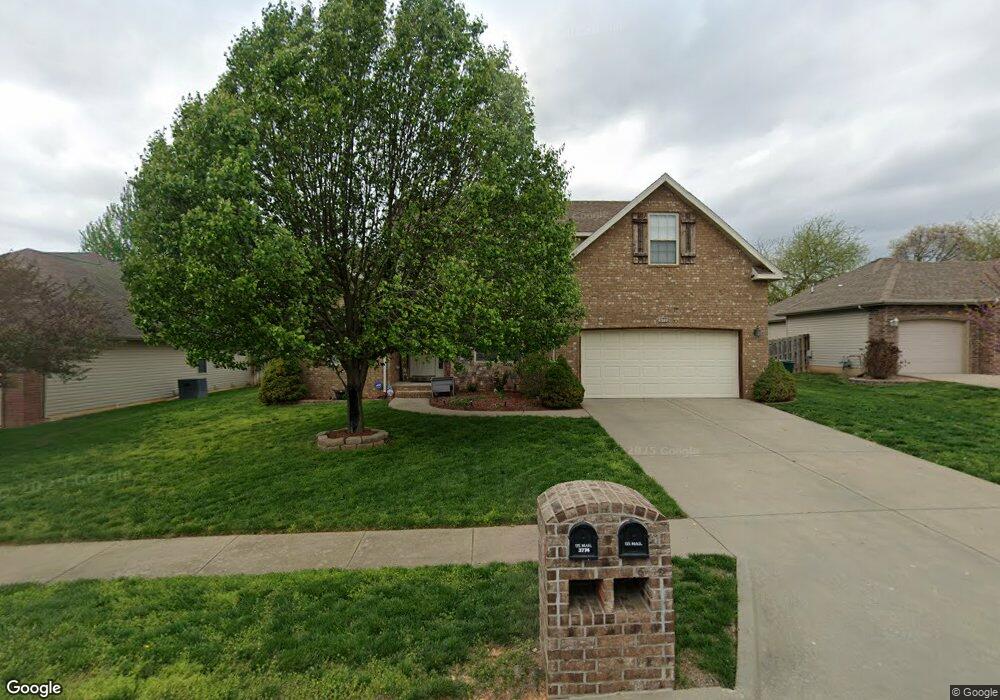
3773 N Mccurry Ave Springfield, MO 65803
Estimated Value: $312,000 - $347,000
4
Beds
3
Baths
2,046
Sq Ft
$160/Sq Ft
Est. Value
About This Home
This home is located at 3773 N Mccurry Ave, Springfield, MO 65803 and is currently estimated at $328,258, approximately $160 per square foot. 3773 N Mccurry Ave is a home located in Greene County with nearby schools including Truman Elementary School, Pleasant View K-8 School, and Hillcrest High School.
Ownership History
Date
Name
Owned For
Owner Type
Purchase Details
Closed on
Nov 4, 2011
Sold by
Springer John C and Springer Deanna
Bought by
Jasper Ronald W and Jasper Shajuana D
Current Estimated Value
Purchase Details
Closed on
Dec 2, 2009
Sold by
Springer John C and Springer Deanna S
Bought by
Jasper Ronald W and Jasper Shajuana
Purchase Details
Closed on
Mar 5, 2008
Sold by
D & J Investment Properties Llc
Bought by
Springer John C and Springer Deanna
Create a Home Valuation Report for This Property
The Home Valuation Report is an in-depth analysis detailing your home's value as well as a comparison with similar homes in the area
Purchase History
We collect this data history from publicly available records. To have your information removed, we recommend requesting removal directly through your county’s website.
| Date | Buyer | Sale Price | Title Company |
|---|---|---|---|
| Jasper Ronald W | -- | None Available | |
| Jasper Ronald W | $199,900 | None Available | |
| Springer John C | -- | None Available |
Source: Public Records
Mortgage History
We collect this data history from publicly available records. To have your information removed, we recommend requesting removal directly through your county’s website.
| Date | Status | Borrower | Loan Amount |
|---|---|---|---|
| Closed | Jasper Ronald W | $0 |
Source: Public Records
Tax History
| Year | Tax Paid | Tax Assessment Tax Assessment Total Assessment is a certain percentage of the fair market value that is determined by local assessors to be the total taxable value of land and additions on the property. | Land | Improvement |
|---|---|---|---|---|
| 2025 | $2,606 | $48,180 | $7,600 | $40,580 |
| 2024 | $2,610 | $45,090 | $5,700 | $39,390 |
| 2023 | $2,597 | $45,090 | $5,700 | $39,390 |
| 2022 | $2,393 | $40,720 | $5,700 | $35,020 |
| 2021 | $2,289 | $40,720 | $5,700 | $35,020 |
| 2020 | $2,075 | $35,040 | $5,700 | $29,340 |
| 2019 | $2,017 | $35,040 | $5,700 | $29,340 |
| 2018 | $2,023 | $34,980 | $5,700 | $29,280 |
| 2017 | $2,005 | $31,810 | $5,700 | $26,110 |
| 2016 | $1,820 | $31,810 | $5,700 | $26,110 |
| 2015 | $1,807 | $31,810 | $5,700 | $26,110 |
| 2014 | $1,817 | $31,810 | $5,700 | $26,110 |
Source: Public Records
Map
Nearby Homes
- 3746 N Croswell Ave
- 621 Meadowgate Dr
- 671 W Bridgewood Ct
- 3582 N Thistlewood Ct
- 441 W Farm Road 96
- 1632 N Grant Ave
- 4377 N Toby Ave
- 3879 N Williams Ct
- 4473 N Toby Ave
- 4482 N Toby Ave
- 4497 N Toby Ave
- 906 E Caravan St
- 1050 E Camorene St
- 801 E Hill St
- 1017 E McClernon St
- 1270 E Ogorman Ct
- 434 W Evergreen St
- 1107 E Smith St
- 1113 E Smith St
- 3486 N Farm Road 143
- 3761 N Mccurry Ave
- 3785 N Mccurry Ave
- 3772 N Bridgewood Ave
- 3760 N Bridgewood Ave
- 3784 N Bridgewood Ave
- 3774 N Mccurry Ave
- 3749 N Mccurry Ave
- 3748 N Bridgewood Ave
- 3786 N Mccurry Ave
- 3762 N Mccurry Ave
- 3737 N Mccurry Ave
- 3796 N Bridgewood Ave
- 3750 N Mccurry Ave
- 3736 N Bridgewood Ave
- 353 W Meadowgate Dr
- 3808 N Bridgewood Ave
- 341 E Meadowgate Dr
- 3738 N Mccurry Ave
- 3771 N Bridgewood Ave
- 3759 N Bridgewood Ave
Your Personal Tour Guide
Ask me questions while you tour the home.