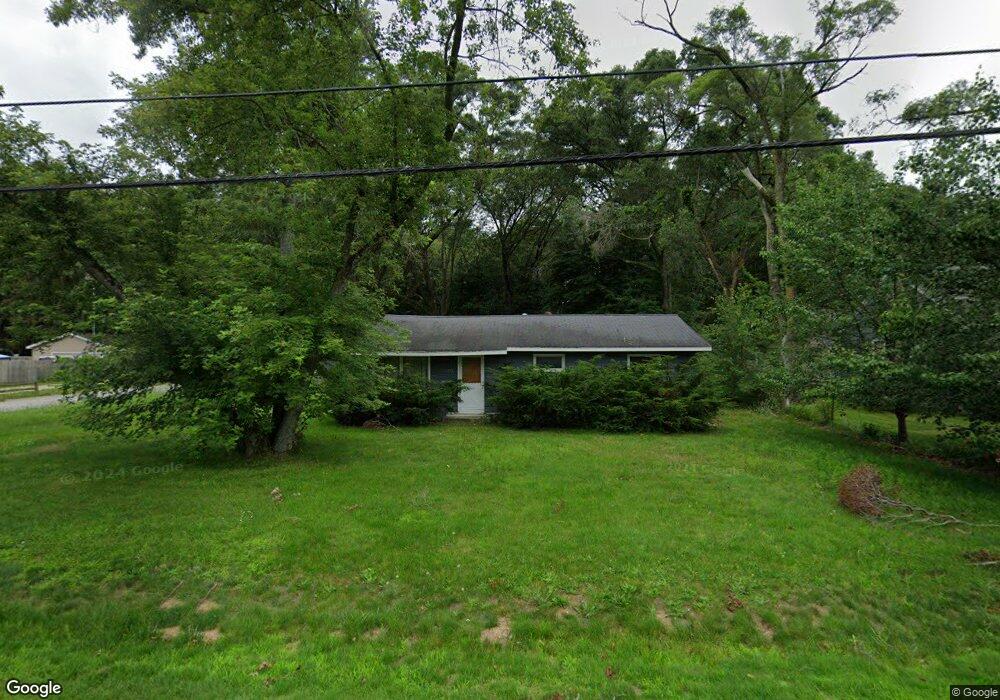
3773 S Sheridan Dr Muskegon, MI 49444
Estimated Value: $286,000 - $305,000
3
Beds
3
Baths
1,560
Sq Ft
$189/Sq Ft
Est. Value
About This Home
This home is located at 3773 S Sheridan Dr, Muskegon, MI 49444 and is currently estimated at $294,973, approximately $189 per square foot. 3773 S Sheridan Dr is a home located in Muskegon County with nearby schools including Fruitport High School and Broadway Baptist School.
Ownership History
Date
Name
Owned For
Owner Type
Purchase Details
Closed on
Jul 16, 2020
Sold by
Mezeske Phillip J and Mezeske Barbara K
Bought by
Mezeskemi Llc
Current Estimated Value
Purchase Details
Closed on
Sep 11, 2017
Sold by
Home & Land Finance Llc
Bought by
Mezeske Phillip 3 and Mezeske Barbara K
Purchase Details
Closed on
Oct 28, 2016
Sold by
Wolf James L and Wolf Maria
Bought by
Home & Land Finance Llc
Purchase Details
Closed on
Mar 18, 2016
Sold by
Wolf James L and Wolf Maria
Bought by
Home & Land Finance Llc
Purchase Details
Closed on
Dec 13, 2006
Sold by
Wolf James L
Bought by
Wolf James L and Estate Of Phyllis A Wolfe
Home Financials for this Owner
Home Financials are based on the most recent Mortgage that was taken out on this home.
Original Mortgage
$61,000
Interest Rate
6.27%
Mortgage Type
Stand Alone Refi Refinance Of Original Loan
Purchase Details
Closed on
Sep 22, 2006
Sold by
Wolfe Phyllis
Bought by
Fifth Third Bank
Create a Home Valuation Report for This Property
The Home Valuation Report is an in-depth analysis detailing your home's value as well as a comparison with similar homes in the area
Home Values in the Area
Average Home Value in this Area
Purchase History
| Date | Buyer | Sale Price | Title Company |
|---|---|---|---|
| Mezeskemi Llc | -- | None Available | |
| Mezeske Phillip 3 | -- | None Available | |
| Home & Land Finance Llc | $142,233 | None Available | |
| Home & Land Finance Llc | $60,821 | Attorney | |
| Wolf James L | -- | None Available | |
| Fifth Third Bank | $26,000 | None Available |
Source: Public Records
Mortgage History
| Date | Status | Borrower | Loan Amount |
|---|---|---|---|
| Previous Owner | Wolf James L | $61,000 |
Source: Public Records
Tax History Compared to Growth
Tax History
| Year | Tax Paid | Tax Assessment Tax Assessment Total Assessment is a certain percentage of the fair market value that is determined by local assessors to be the total taxable value of land and additions on the property. | Land | Improvement |
|---|---|---|---|---|
| 2025 | $4,478 | $133,100 | $0 | $0 |
| 2024 | $3,580 | $124,900 | $0 | $0 |
| 2023 | $3,423 | $110,400 | $0 | $0 |
| 2022 | $3,984 | $97,100 | $0 | $0 |
| 2021 | $3,870 | $90,600 | $0 | $0 |
| 2020 | $3,826 | $82,900 | $0 | $0 |
| 2019 | $3,758 | $78,000 | $0 | $0 |
| 2018 | $3,602 | $71,700 | $0 | $0 |
| 2017 | $1,634 | $66,900 | $0 | $0 |
| 2016 | $993 | $57,000 | $0 | $0 |
| 2015 | -- | $55,300 | $0 | $0 |
| 2014 | -- | $57,500 | $0 | $0 |
| 2013 | -- | $48,700 | $0 | $0 |
Source: Public Records
Map
Nearby Homes
- V/L S Sheridan Dr
- 2355 Cress Creek Dr
- 2523 Heights Ravenna Rd
- 2322 Cline Rd
- 3241 Medema St
- 3471 Kersting Dr
- 3835 Ellen St
- 4441 S Sheridan Dr
- 3249 de Feyter St
- 3705 S Dangl Rd
- 4563 Keener St
- 3222 George St
- 3176 Klug St
- 2171 Monte Ave
- 2338 E Columbia Ave
- 4697 S Quarterline Rd
- 2488 E Broadway Ave
- 1454 Airport Rd
- 3658 Stephanie Ln
- 3125 Stratford St
- 3761 S Sheridan Dr
- 3799 S Sheridan Dr
- 3747 S Sheridan Dr
- 3772 S Sheridan Dr
- 3760 S Sheridan Dr
- 3811 S Sheridan Dr
- 3733 S Sheridan Dr
- 3742 S Sheridan Dr
- 2440 Sheringer Rd
- 3816 S Sheridan Dr
- 3773 Manning St
- 3728 S Sheridan Dr
- 3719 S Sheridan Dr
- 3810 Manning St
- 3757 Manning St
- 3835 Manning St
- 3743 Manning St
- 3718 S Sheridan Dr
- 3707 S Sheridan Dr
- 2355 Filonow Dr