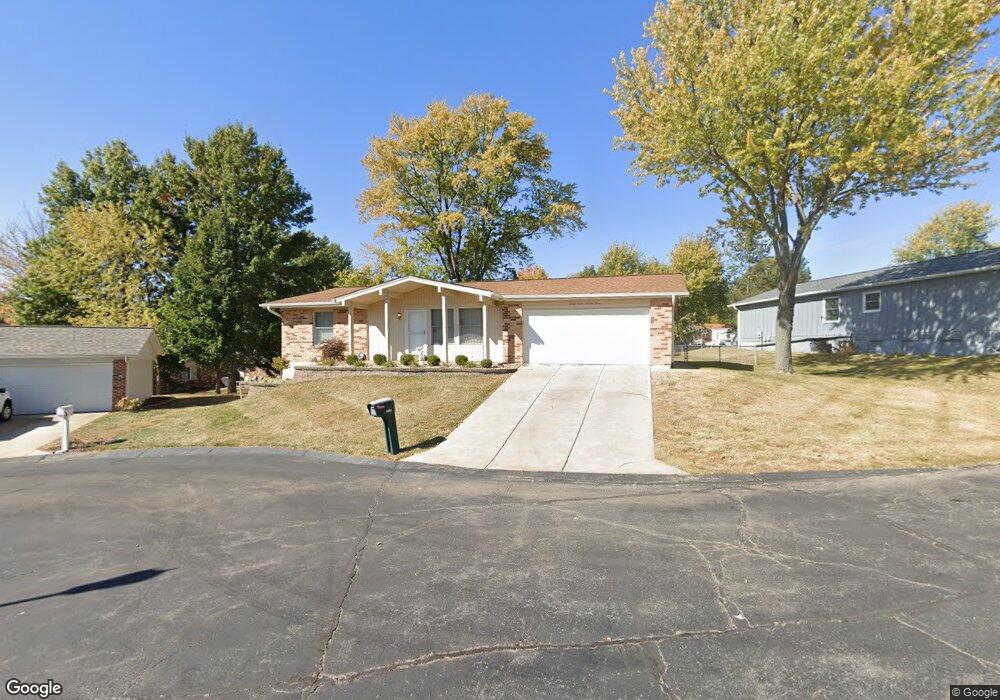
3773 Stephanie Ct Arnold, MO 63010
Estimated Value: $216,755 - $301,000
Studio
--
Bath
1,392
Sq Ft
$188/Sq Ft
Est. Value
About This Home
This home is located at 3773 Stephanie Ct, Arnold, MO 63010 and is currently estimated at $261,939, approximately $188 per square foot. 3773 Stephanie Ct is a home located in Jefferson County with nearby schools including Richard Simpson Elementary School, Seckman Middle School, and Seckman Senior High School.
Ownership History
Date
Name
Owned For
Owner Type
Purchase Details
Closed on
Feb 2, 2013
Sold by
Cirar Edward M
Bought by
Cirar Edward M and Edward M Cirar Jr Revocable Trust
Current Estimated Value
Purchase Details
Closed on
Dec 24, 2012
Sold by
Birr Victoria L and Birr John
Bought by
Cirar Edward M and Circar Edward M
Purchase Details
Closed on
Dec 12, 2012
Sold by
Denney Cheri L and Lewis Austin E
Bought by
Cirar Edward M and Cirar Edward M
Purchase Details
Closed on
Dec 10, 2012
Sold by
Lewis Steven A and Lewis Valerie
Bought by
Cirar Edward M and Cirar Edward W
Purchase Details
Closed on
Dec 8, 2012
Sold by
Lewis Kevin E and Lewis Mayura C
Bought by
Cirar Edward M and Cirar Edward M
Create a Home Valuation Report for This Property
The Home Valuation Report is an in-depth analysis detailing your home's value as well as a comparison with similar homes in the area
Home Values in the Area
Average Home Value in this Area
Purchase History
| Date | Buyer | Sale Price | Title Company |
|---|---|---|---|
| Cirar Edward M | -- | None Available | |
| Cirar Edward M | -- | None Available | |
| Cirar Edward M | -- | None Available | |
| Cirar Edward M | -- | None Available | |
| Cirar Edward M | -- | None Available |
Source: Public Records
Tax History
| Year | Tax Paid | Tax Assessment Tax Assessment Total Assessment is a certain percentage of the fair market value that is determined by local assessors to be the total taxable value of land and additions on the property. | Land | Improvement |
|---|---|---|---|---|
| 2025 | $1,727 | $25,700 | $2,700 | $23,000 |
| 2024 | $1,727 | $24,200 | $2,700 | $21,500 |
| 2023 | $1,727 | $24,200 | $2,700 | $21,500 |
| 2022 | $1,715 | $24,200 | $2,700 | $21,500 |
| 2021 | $1,716 | $24,200 | $2,700 | $21,500 |
| 2020 | $1,617 | $21,600 | $2,300 | $19,300 |
| 2019 | $1,622 | $21,600 | $2,300 | $19,300 |
| 2018 | $1,610 | $21,600 | $2,300 | $19,300 |
| 2017 | $1,559 | $21,600 | $2,300 | $19,300 |
| 2016 | $1,312 | $19,600 | $2,300 | $17,300 |
| 2015 | $1,315 | $19,600 | $2,300 | $17,300 |
| 2013 | -- | $19,400 | $2,300 | $17,100 |
Source: Public Records
Map
Nearby Homes
- 2451 Elm Dr
- 3869 Crystal Wood Dr
- 3820 N Barrington Ct
- 80 Rex Aire Ct
- 2149 Windemere Dr
- 1715 Woodwind Dr
- 3001 Northern Lights Dr
- 3261 5 Oaks Dr
- 2112 Santiago Dr
- 3220 Quervo Ln
- 3224 Quervo Ln
- 3232 Quervo Ln
- 2721 Cindy Dr
- 3233 Quervo Ln
- 3 Aspen II at Bella Terra
- 1957 Forest Haven Dr
- 3 Aspen at Bella Terra
- 3 Sterling at Bella Terra
- 4518 Bella Terra Dr
- 3 Ashford at Bella Terra
- 3769 Stephanie Ct
- 3777 Stephanie Ct
- 3770 Cindy Ct
- 3766 Cindy Ct
- 3774 Cindy Ct
- 3772 Stephanie Ct
- 3765 Stephanie Ct
- 3768 Stephanie Ct
- 3781 Stephanie Ct
- 3762 Cindy Ct
- 3776 Stephanie Ct
- 3764 Stephanie Ct
- 3779 Cindy Ct
- 13843 St Rd 21
- 3761 Stephanie Ct
- 2748 Corral Estate
- 2760 Corral Estate
- 3771 Cindy Ct
- 3775 Cindy Ct
- 3767 Cindy Ct
Your Personal Tour Guide
Ask me questions while you tour the home.