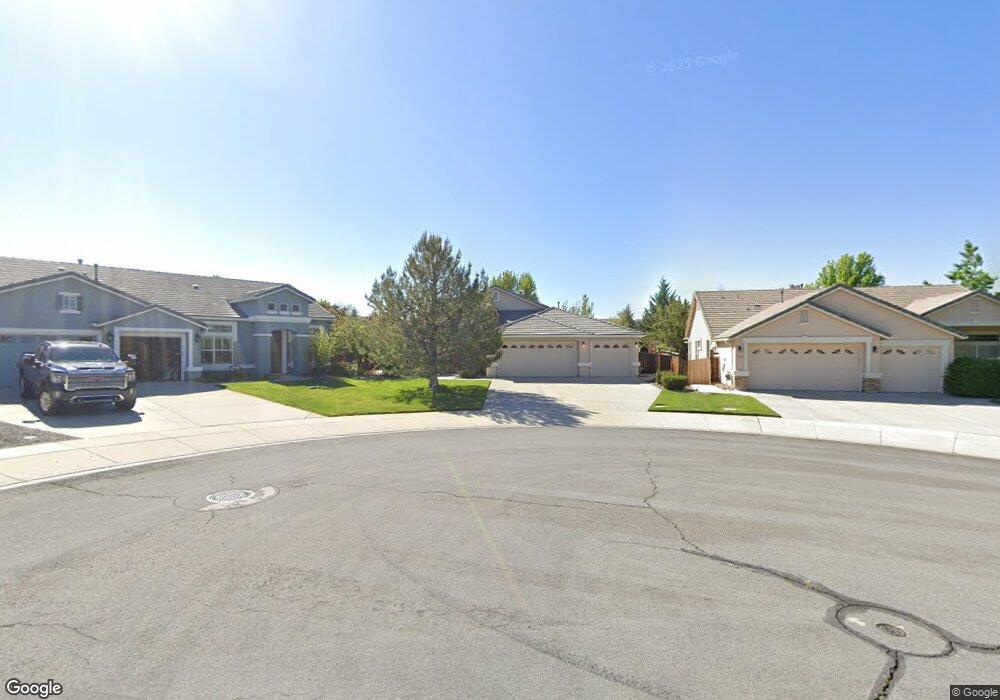
3773 Ulysses Ct Sparks, NV 89436
Wingfield Springs NeighborhoodEstimated Value: $647,437 - $671,000
4
Beds
2
Baths
2,107
Sq Ft
$313/Sq Ft
Est. Value
About This Home
This home is located at 3773 Ulysses Ct, Sparks, NV 89436 and is currently estimated at $660,359, approximately $313 per square foot. 3773 Ulysses Ct is a home located in Washoe County with nearby schools including Dana Elementary School, Southern Elementary School, and Spanish Springs Elementary School.
Ownership History
Date
Name
Owned For
Owner Type
Purchase Details
Closed on
Oct 9, 2009
Sold by
Wright Harry M and Wright Ionia L
Bought by
Wright Harry M and Wright Ionia L
Current Estimated Value
Purchase Details
Closed on
Jun 29, 2007
Sold by
Hobbs Christopher T and Hobbs Mindy A
Bought by
Wright Harry M and Wright Ionia L
Purchase Details
Closed on
Feb 1, 2005
Sold by
Reynen & Bardis The Foothills Llc
Bought by
Hobbs Christopher T and Hobbs Mindy A
Home Financials for this Owner
Home Financials are based on the most recent Mortgage that was taken out on this home.
Original Mortgage
$237,600
Interest Rate
5%
Mortgage Type
Unknown
Create a Home Valuation Report for This Property
The Home Valuation Report is an in-depth analysis detailing your home's value as well as a comparison with similar homes in the area
Home Values in the Area
Average Home Value in this Area
Purchase History
| Date | Buyer | Sale Price | Title Company |
|---|---|---|---|
| Wright Harry M | -- | None Available | |
| Wright Harry M | -- | None Available | |
| Wright Harry M | $350,000 | First American Title | |
| Hobbs Christopher T | $298,500 | First American Title |
Source: Public Records
Mortgage History
| Date | Status | Borrower | Loan Amount |
|---|---|---|---|
| Previous Owner | Hobbs Christopher T | $237,600 | |
| Closed | Hobbs Christopher T | $15,000 |
Source: Public Records
Tax History Compared to Growth
Tax History
| Year | Tax Paid | Tax Assessment Tax Assessment Total Assessment is a certain percentage of the fair market value that is determined by local assessors to be the total taxable value of land and additions on the property. | Land | Improvement |
|---|---|---|---|---|
| 2026 | $2,433 | $157,592 | $46,268 | $111,323 |
| 2025 | $3,157 | $159,124 | $46,121 | $113,003 |
| 2024 | $3,157 | $153,659 | $39,837 | $113,822 |
| 2023 | $3,066 | $152,821 | $45,460 | $107,361 |
| 2022 | $2,977 | $126,695 | $37,265 | $89,430 |
| 2021 | $2,891 | $118,586 | $29,768 | $88,818 |
| 2020 | $2,805 | $118,068 | $29,253 | $88,815 |
| 2019 | $2,724 | $115,051 | $28,996 | $86,055 |
| 2018 | $2,644 | $105,691 | $21,572 | $84,119 |
| 2017 | $2,569 | $104,064 | $19,882 | $84,182 |
| 2016 | $2,502 | $98,999 | $18,044 | $80,955 |
| 2015 | $2,499 | $92,702 | $18,008 | $74,694 |
| 2014 | $2,427 | $76,249 | $13,928 | $62,321 |
| 2013 | -- | $64,934 | $11,319 | $53,615 |
Source: Public Records
Map
Nearby Homes
- 7483 Europa Dr
- 7464 Europa Dr
- 7718 Rhythm Cir
- 7423 Comet Ct
- 8495 Eaglenest Rd
- 7778 Cerritos Cir Unit 7
- 7766 Corneta Ct
- 3716 Early Dawn Dr
- 8570 Eaglenest Rd
- 7260 Treeline Ct
- 7220 Windswept Loop
- 7842 Alcandre Ct
- 7657 Bareback Dr
- 7262 Lacerta Dr
- 7480 Windswept Loop
- 3245 Gerona Ct
- 7422 Windswept Loop
- 3461 Tavira Ct
- 7366 Grand Island Dr
- 7311 S Florentine Dr Unit 10A
- 3763 Ulysses Ct
- 3783 Ulysses Ct
- 7525 Bareback Dr
- 7515 Bareback Dr
- 3753 Ulysses Ct
- 3753 Ulysses Ct Unit Suite 103
- 7535 Bareback Dr
- 7505 Bareback Dr
- 7545 Bareback Dr
- 3743 Ulysses Ct
- 3764 Ulysses Ct
- 3774 Ulysses Ct
- 3754 Ulysses Ct
- 7555 Bareback Dr
- 3744 Ulysses Ct
- 3734 Ulysses Ct
- 7550 Bareback Dr
- 7584 Ulysses Dr
- 3724 Ulysses Ct
- 7560 Bareback Dr