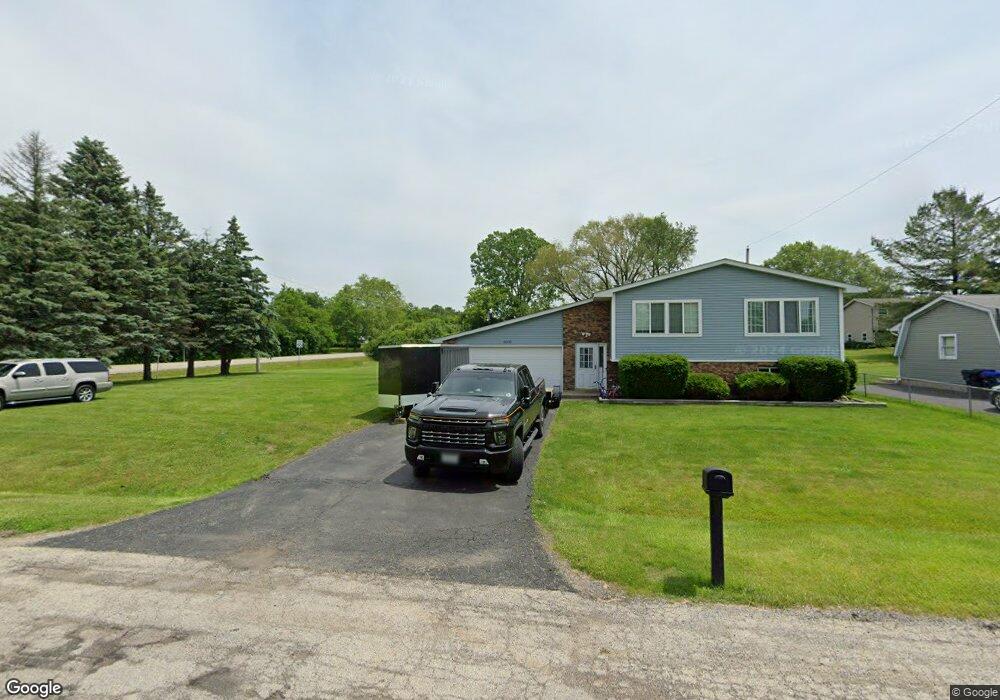
37733 N Bayonne Ave Beach Park, IL 60087
Estimated Value: $313,175 - $375,000
4
Beds
2
Baths
1,430
Sq Ft
$243/Sq Ft
Est. Value
About This Home
This home is located at 37733 N Bayonne Ave, Beach Park, IL 60087 and is currently estimated at $346,794, approximately $242 per square foot. 37733 N Bayonne Ave is a home located in Lake County with nearby schools including H R McCall Elementary School, Jack Benny Middle School, and Waukegan High School.
Ownership History
Date
Name
Owned For
Owner Type
Purchase Details
Closed on
Oct 5, 2017
Sold by
Moosa Mohannad
Bought by
Alvarez Armando
Current Estimated Value
Home Financials for this Owner
Home Financials are based on the most recent Mortgage that was taken out on this home.
Original Mortgage
$172,160
Outstanding Balance
$146,345
Interest Rate
4.5%
Mortgage Type
New Conventional
Estimated Equity
$200,449
Purchase Details
Closed on
Aug 28, 2015
Sold by
Moosa Sherbano and Sodagar Kadar
Bought by
Moosa Mohannad
Purchase Details
Closed on
Nov 16, 2005
Sold by
Moosa Sher Bano
Bought by
Sodagar Kadar
Purchase Details
Closed on
Aug 19, 2002
Sold by
Collymore Donald C and Collymore Gloria
Bought by
Moosa Sher Bano I
Home Financials for this Owner
Home Financials are based on the most recent Mortgage that was taken out on this home.
Original Mortgage
$125,000
Interest Rate
5.5%
Create a Home Valuation Report for This Property
The Home Valuation Report is an in-depth analysis detailing your home's value as well as a comparison with similar homes in the area
Home Values in the Area
Average Home Value in this Area
Purchase History
| Date | Buyer | Sale Price | Title Company |
|---|---|---|---|
| Alvarez Armando | $178,000 | Alliance Title Corporation | |
| Moosa Mohannad | -- | Attorney | |
| Sodagar Kadar | -- | -- | |
| Moosa Sher Bano I | $205,000 | First American Title |
Source: Public Records
Mortgage History
| Date | Status | Borrower | Loan Amount |
|---|---|---|---|
| Open | Alvarez Armando | $172,160 | |
| Previous Owner | Moosa Sher Bano I | $125,000 |
Source: Public Records
Tax History Compared to Growth
Tax History
| Year | Tax Paid | Tax Assessment Tax Assessment Total Assessment is a certain percentage of the fair market value that is determined by local assessors to be the total taxable value of land and additions on the property. | Land | Improvement |
|---|---|---|---|---|
| 2024 | $5,352 | $101,151 | $8,527 | $92,624 |
| 2023 | $5,135 | $79,074 | $7,498 | $71,576 |
| 2022 | $5,135 | $72,197 | $7,856 | $64,341 |
| 2021 | $4,772 | $63,778 | $7,007 | $56,771 |
| 2020 | $4,838 | $59,417 | $6,528 | $52,889 |
| 2019 | $4,858 | $54,446 | $5,982 | $48,464 |
| 2018 | $5,500 | $55,526 | $6,773 | $48,753 |
| 2017 | $5,693 | $49,125 | $5,992 | $43,133 |
| 2016 | $5,448 | $42,688 | $5,207 | $37,481 |
| 2015 | $4,489 | $38,206 | $4,660 | $33,546 |
| 2014 | $3,877 | $33,978 | $3,485 | $30,493 |
| 2012 | $5,163 | $36,810 | $3,775 | $33,035 |
Source: Public Records
Map
Nearby Homes
- 12609 W Paddock Ave
- 12655 W Warner St
- 36245 N Green Bay Rd
- 3101 Country Club Ln
- 12582 W Beach Rd
- 13377 W Blanchard Rd
- 38603 N Pine Grove Ave
- 2625 Vercoe Ave
- 0 W Hendee Rd
- 37371 N Shirley Dr
- 2615 Blanchard Rd
- 4150 Midlane Dr
- 13076 W Pickford St
- 4171 Midlane Dr
- 2708 Dana Ave
- 38859 N Green Bay Rd
- 2246 Ottawa Rd
- 2630 Woodview Ct
- 36847 N Delany Rd
- 38148 N Helena Ln
- 37707 N Bayonne Ave
- 12968 W Bairstow Ave
- 37700 N Bayonne Ave
- 12958 W Bairstow Ave
- 37665 N Bayonne Ave
- 12922 W Yorkhouse Rd
- 12914 W Yorkhouse Rd
- 12914 W York House Rd
- 12882 W Yorkhouse Rd
- 37600 N Bayonne Ave
- 12987 W Mawman Ave
- 12955 W Mawman Ave
- 37576 N Bayonne Ave
- 37581 N Bayonne Ave
- 12950 W Eastwood Rd
- 37542 N Bayonne Ave
- 37547 N Bayonne Ave
- 12850 W Eastwood Rd
- 12741 W Yorkhouse Rd
- 13029 W Town Line Rd