37735 Colonial Dr Unit 80 Westland, MI 48185
Estimated Value: $147,000 - $183,673
--
Bed
2
Baths
1,059
Sq Ft
$160/Sq Ft
Est. Value
About This Home
This home is located at 37735 Colonial Dr Unit 80, Westland, MI 48185 and is currently estimated at $168,918, approximately $159 per square foot. 37735 Colonial Dr Unit 80 is a home located in Wayne County with nearby schools including Rosedale Elementary, Johnson Upper Elementary School, and Frost Middle School.
Ownership History
Date
Name
Owned For
Owner Type
Purchase Details
Closed on
May 22, 2017
Sold by
Sula Daniel and Sula Tiffany
Bought by
Pl Haiyan
Current Estimated Value
Home Financials for this Owner
Home Financials are based on the most recent Mortgage that was taken out on this home.
Original Mortgage
$75,000
Outstanding Balance
$62,234
Interest Rate
4.02%
Mortgage Type
New Conventional
Estimated Equity
$106,684
Purchase Details
Closed on
Oct 23, 2015
Sold by
Motsch Tiffany
Bought by
Sula Tiffany
Purchase Details
Closed on
Jul 17, 2014
Sold by
Luttman Ronda M and Tullock Robert D
Bought by
Motsch Timothy
Purchase Details
Closed on
Nov 3, 2006
Sold by
Tullock Ronald
Bought by
Tullock Ronald
Purchase Details
Closed on
Nov 27, 2003
Sold by
Kierszkowski Brian
Bought by
Tullock Ronald
Purchase Details
Closed on
Apr 2, 1997
Sold by
Selina L Anderson
Bought by
Madeline & Russell Street
Create a Home Valuation Report for This Property
The Home Valuation Report is an in-depth analysis detailing your home's value as well as a comparison with similar homes in the area
Home Values in the Area
Average Home Value in this Area
Purchase History
| Date | Buyer | Sale Price | Title Company |
|---|---|---|---|
| Pl Haiyan | $83,500 | None Available | |
| Sula Tiffany | -- | None Available | |
| Motsch Timothy | -- | None Available | |
| Tullock Ronald | -- | None Available | |
| Tullock Ronald | $123,500 | Multiple | |
| Madeline & Russell Street | $3,500 | -- |
Source: Public Records
Mortgage History
| Date | Status | Borrower | Loan Amount |
|---|---|---|---|
| Open | Pl Haiyan | $75,000 |
Source: Public Records
Tax History Compared to Growth
Tax History
| Year | Tax Paid | Tax Assessment Tax Assessment Total Assessment is a certain percentage of the fair market value that is determined by local assessors to be the total taxable value of land and additions on the property. | Land | Improvement |
|---|---|---|---|---|
| 2025 | $1,970 | $77,500 | $0 | $0 |
| 2024 | $1,970 | $70,200 | $0 | $0 |
| 2023 | $1,881 | $68,800 | $0 | $0 |
| 2022 | $2,120 | $60,600 | $0 | $0 |
| 2021 | $2,066 | $55,700 | $0 | $0 |
| 2020 | $2,046 | $46,200 | $0 | $0 |
| 2019 | $1,949 | $40,900 | $0 | $0 |
| 2018 | $1,610 | $40,500 | $0 | $0 |
| 2017 | $407 | $39,900 | $0 | $0 |
| 2016 | $1,244 | $35,100 | $0 | $0 |
| 2015 | $2,597 | $29,240 | $0 | $0 |
| 2013 | $2,659 | $27,800 | $0 | $0 |
| 2012 | $1,172 | $26,700 | $0 | $0 |
Source: Public Records
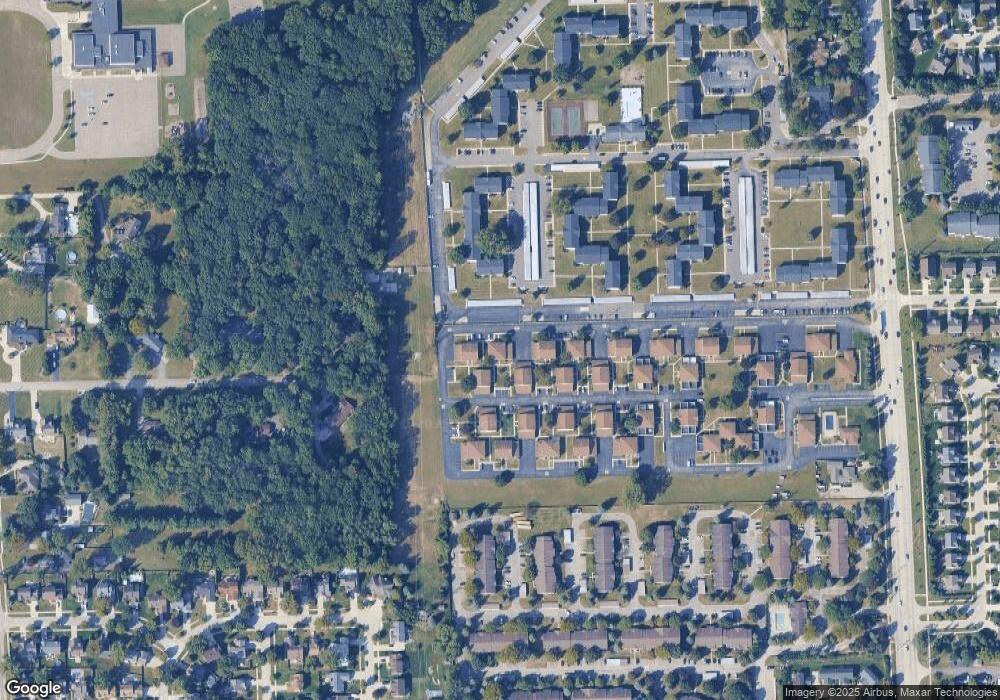
Map
Nearby Homes
- 37742 Colonial Dr
- 37674 Colonial Dr S
- 38489 Sycamore Ct Unit 89
- 7908 Everett Dr
- 38508 Alma Ln
- 7970 Russell Dr
- 37739 Northfield Ave
- 38671 Belliveau St
- 8894 Knolson Ave
- Lot 35 Ravine Dr
- 8228 Quincy Dr
- 39122 Dover St
- 7630 Woodview St Unit 2
- 38876 Northfield Ave
- 7655 Koppernick Rd
- 7330 Woodview St Unit 2
- 7370 Woodview St Unit 3
- 9130 E Bassett Ct
- 36435 Grandon St
- 8364 Holly Dr
- 37731 Colonial Dr
- 37723 Colonial Dr Unit 84
- 37739 Colonial Dr
- 37719 Colonial Dr Unit 83
- 37719 Colonial Dr Unit 27 83
- 37735 Colonial Dr N
- 37715 Colonial Dr Unit 82
- 37747 Colonial Dr
- 37759 Colonial Dr Unit 70
- 37759 Colonial Dr N Unit 70
- 37751 Colonial Dr Unit 75
- 37727 Colonial Dr
- 37707 Colonial Dr Unit 87
- 37703 Colonial Dr Unit 88
- 37755 Colonial Dr Unit 76
- 37699 Colonial Dr
- 37767 Colonial Dr Unit 72
- 37743 Colonial Dr Unit 73
- 37687 Colonial Dr
- 37747 Colonial Dr N