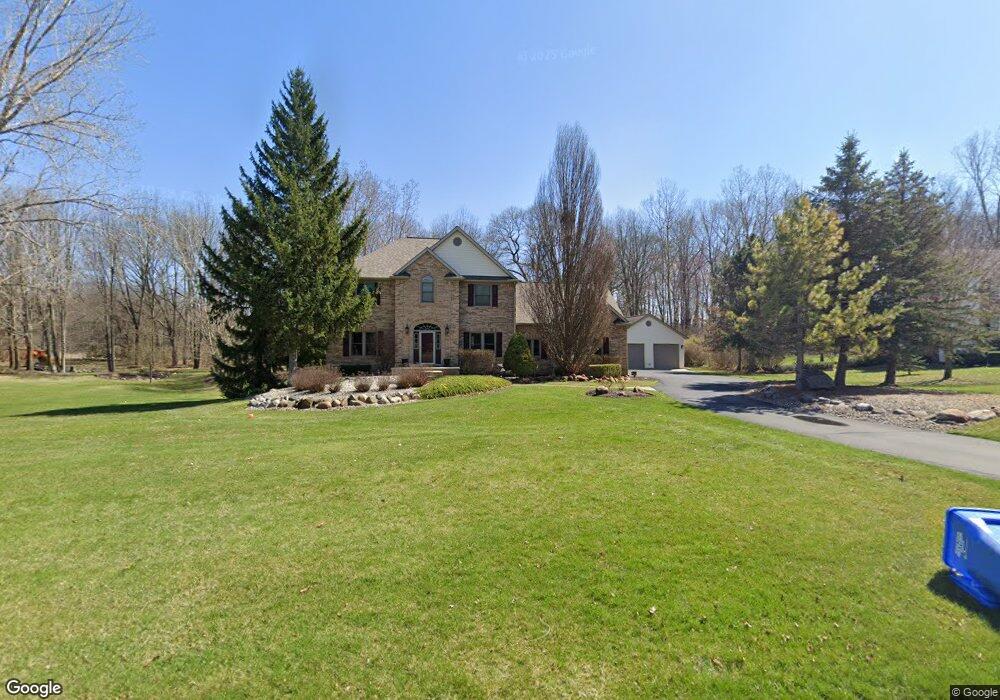
3777 Kipling Cir Howell, MI 48843
Estimated Value: $628,000 - $850,000
4
Beds
4
Baths
3,007
Sq Ft
$232/Sq Ft
Est. Value
About This Home
This home is located at 3777 Kipling Cir, Howell, MI 48843 and is currently estimated at $699,099, approximately $232 per square foot. 3777 Kipling Cir is a home located in Livingston County with nearby schools including Parker Middle School and Howell High School.
Ownership History
Date
Name
Owned For
Owner Type
Purchase Details
Closed on
Feb 24, 2022
Sold by
Jill Hayden
Bought by
Jill Hayden Revocable Trust
Current Estimated Value
Purchase Details
Closed on
Jan 6, 2022
Sold by
Klein Frank E
Bought by
Hayden Jill L
Purchase Details
Closed on
May 29, 2013
Sold by
Klein Frank E and Hayden Jill L
Bought by
Klein Frank E and Hayden Jill L
Purchase Details
Closed on
May 28, 2013
Sold by
Klein Frank E and Hayden Jill L
Bought by
Klein Frank E and Hayden Jill L
Purchase Details
Closed on
Oct 20, 1999
Sold by
Maynerich Construction Inc
Bought by
Tomasko Michael P and Tomasko Kathleen J
Create a Home Valuation Report for This Property
The Home Valuation Report is an in-depth analysis detailing your home's value as well as a comparison with similar homes in the area
Home Values in the Area
Average Home Value in this Area
Purchase History
| Date | Buyer | Sale Price | Title Company |
|---|---|---|---|
| Jill Hayden Revocable Trust | -- | Shea Aiello Pllc | |
| Hayden Jill L | -- | Michaels Matthew W | |
| Klein Frank E | -- | -- | |
| Klein Frank E | -- | -- | |
| Tomasko Michael P | $320,000 | Metropolitan Title Company |
Source: Public Records
Tax History
| Year | Tax Paid | Tax Assessment Tax Assessment Total Assessment is a certain percentage of the fair market value that is determined by local assessors to be the total taxable value of land and additions on the property. | Land | Improvement |
|---|---|---|---|---|
| 2025 | $3,471 | $297,000 | $0 | $0 |
| 2024 | $3,372 | $275,700 | $0 | $0 |
| 2023 | $3,221 | $251,300 | $0 | $0 |
| 2022 | $4,814 | $225,500 | $0 | $0 |
| 2021 | $4,653 | $229,700 | $0 | $0 |
| 2020 | $4,720 | $229,000 | $0 | $0 |
| 2019 | $4,653 | $225,500 | $0 | $0 |
| 2018 | $4,438 | $186,900 | $0 | $0 |
| 2017 | $4,058 | $186,900 | $0 | $0 |
| 2016 | $4,032 | $183,800 | $0 | $0 |
| 2014 | $3,846 | $165,000 | $0 | $0 |
| 2012 | $3,846 | $159,900 | $0 | $0 |
Source: Public Records
Map
Nearby Homes
- 3530 Kipling Cir
- 2146 Webster Park Dr
- 2105 Webster Park Dr
- 4315 Gale Dr
- 0000 Crooked Lake Rd
- Parcel 1 E Coon Lake Rd
- Parcel 2 E Coon Lake Rd
- 4681 Roya Trail
- 1047 Weatherstone Ln
- 0 Pinckney Rd Unit 50200988
- 2470 Chilson Rd
- 1 Brighton Rd
- 0000 Brighton Rd
- 4001 S Latson Rd
- 05 Prince Edward Dr
- 1066 Kemperwood Ct
- 8 Sleaford-Parcel 8 - 2 12 Acres Rd
- 4433 Brighton Parcel B Rd
- 4 Sleaford-Parcel 4 - 32 92 Acres Rd
- Lot 5 Misty Meadows
- 3789 Kipling Cir
- 3765 Kipling Cir
- 3801 Kipling Cir
- 2319 E Coon Lake Rd
- 3782 Kipling Cir
- 3796 Kipling Cir
- 3770 Kipling Cir
- 3782 Kipling Circle Farmington Rd
- 3753 Kipling Cir
- 3750 Kipling Cir
- 3810 Kipling Cir
- 3819 Kipling Cir
- 3738 Kipling Cir
- 3518 Kipling Cir
- 0 Kipling Cir
- 3604 Kipling Cir
- 3592 Kipling Cir
- 3634 Kipling Cir
- 3729 Kipling Cir
- 3616 Kipling Cir
Your Personal Tour Guide
Ask me questions while you tour the home.