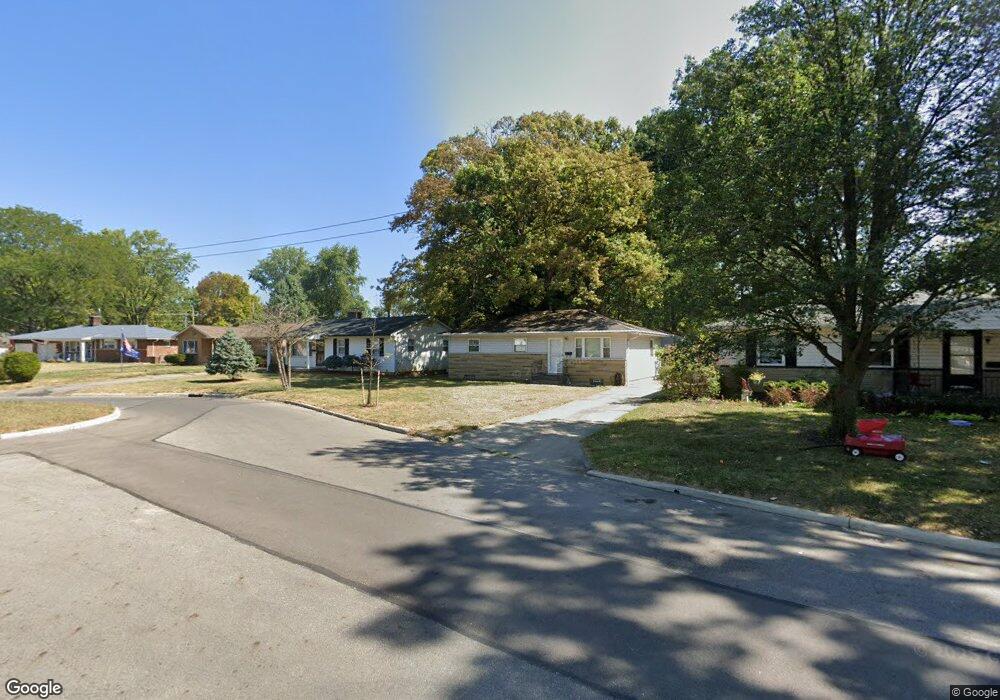
3778 Ganson Dr Columbus, OH 43224
North Linden NeighborhoodEstimated Value: $196,363 - $246,000
3
Beds
1
Bath
988
Sq Ft
$217/Sq Ft
Est. Value
About This Home
This home is located at 3778 Ganson Dr, Columbus, OH 43224 and is currently estimated at $214,341, approximately $216 per square foot. 3778 Ganson Dr is a home located in Franklin County with nearby schools including North Linden Elementary School, Medina Middle School, and Mifflin High School.
Ownership History
Date
Name
Owned For
Owner Type
Purchase Details
Closed on
Jun 25, 2010
Sold by
Busbey David A and Busbey Kelli M
Bought by
Gautsche Randall J
Current Estimated Value
Home Financials for this Owner
Home Financials are based on the most recent Mortgage that was taken out on this home.
Original Mortgage
$95,535
Outstanding Balance
$64,942
Interest Rate
5.5%
Mortgage Type
FHA
Estimated Equity
$149,399
Purchase Details
Closed on
Nov 28, 2003
Sold by
Bowditch Mary A
Bought by
Busbey David A and Busbey Kelli M
Home Financials for this Owner
Home Financials are based on the most recent Mortgage that was taken out on this home.
Original Mortgage
$101,398
Interest Rate
6.07%
Mortgage Type
FHA
Purchase Details
Closed on
Sep 7, 2000
Sold by
Estate Of Robert C Bowditch
Bought by
Bowditch Mary A
Purchase Details
Closed on
Sep 20, 1961
Bought by
Bowditch Robert C
Create a Home Valuation Report for This Property
The Home Valuation Report is an in-depth analysis detailing your home's value as well as a comparison with similar homes in the area
Home Values in the Area
Average Home Value in this Area
Purchase History
| Date | Buyer | Sale Price | Title Company |
|---|---|---|---|
| Gautsche Randall J | $99,000 | Arrow Title Agency Llc | |
| Busbey David A | $103,000 | -- | |
| Bowditch Mary A | -- | -- | |
| Bowditch Robert C | -- | -- |
Source: Public Records
Mortgage History
| Date | Status | Borrower | Loan Amount |
|---|---|---|---|
| Open | Gautsche Randall J | $95,535 | |
| Previous Owner | Busbey David A | $101,398 |
Source: Public Records
Tax History
| Year | Tax Paid | Tax Assessment Tax Assessment Total Assessment is a certain percentage of the fair market value that is determined by local assessors to be the total taxable value of land and additions on the property. | Land | Improvement |
|---|---|---|---|---|
| 2025 | $2,608 | $58,100 | $16,520 | $41,580 |
| 2024 | $2,608 | $58,100 | $16,520 | $41,580 |
| 2023 | $2,574 | $58,100 | $16,520 | $41,580 |
| 2022 | $1,665 | $32,100 | $6,790 | $25,310 |
| 2021 | $1,668 | $32,100 | $6,790 | $25,310 |
| 2020 | $1,670 | $32,100 | $6,790 | $25,310 |
| 2019 | $1,635 | $26,950 | $5,670 | $21,280 |
| 2018 | $1,775 | $26,950 | $5,670 | $21,280 |
| 2017 | $1,873 | $26,950 | $5,670 | $21,280 |
| 2016 | $2,112 | $31,890 | $5,010 | $26,880 |
| 2015 | $1,918 | $31,890 | $5,010 | $26,880 |
| 2014 | $1,922 | $31,890 | $5,010 | $26,880 |
| 2013 | $998 | $33,565 | $5,285 | $28,280 |
Source: Public Records
Map
Nearby Homes
- 3750 Dresden St
- 3620 Walmar Dr
- 3583 Dresden St
- 3585 Gerbert Rd
- 3939 Karl Rd Unit 311
- 3967 Karl Rd Unit 224
- 3941 Karl Rd Unit 326
- 3491 Ontario St
- 3471 Ontario St
- 3508 Kenlawn St
- 1242 Acton Rd
- 3426 Oaklawn St
- 1863 Ward Rd
- 3401 Walmar Dr
- 2010 Melrose Ave
- 3352 Karl Rd
- 4143 Karl Rd Unit 215
- 4143 Karl Rd Unit 314
- 4145 Karl Rd Unit 223
- 2023 Ferris Rd
- 3770 Ganson Dr
- 3784 Ganson Dr
- 3792 Ganson Dr
- 3762 Ganson Dr
- 1582 Hansen Ave
- 1588 Hansen Ave
- 3754 Ganson Dr
- 1576 Hansen Ave
- 3800 Ganson Dr
- 3779 Ganson Dr
- 3771 Ganson Dr
- 1594 Hansen Ave
- 3785 Ganson Dr
- 3763 Ganson Dr
- 3748 Ganson Dr
- 1570 Hansen Ave
- 3791 Ganson Dr
- 3755 Ganson Dr
- 3797 Ganson Dr
- 1564 Hansen Ave
Your Personal Tour Guide
Ask me questions while you tour the home.