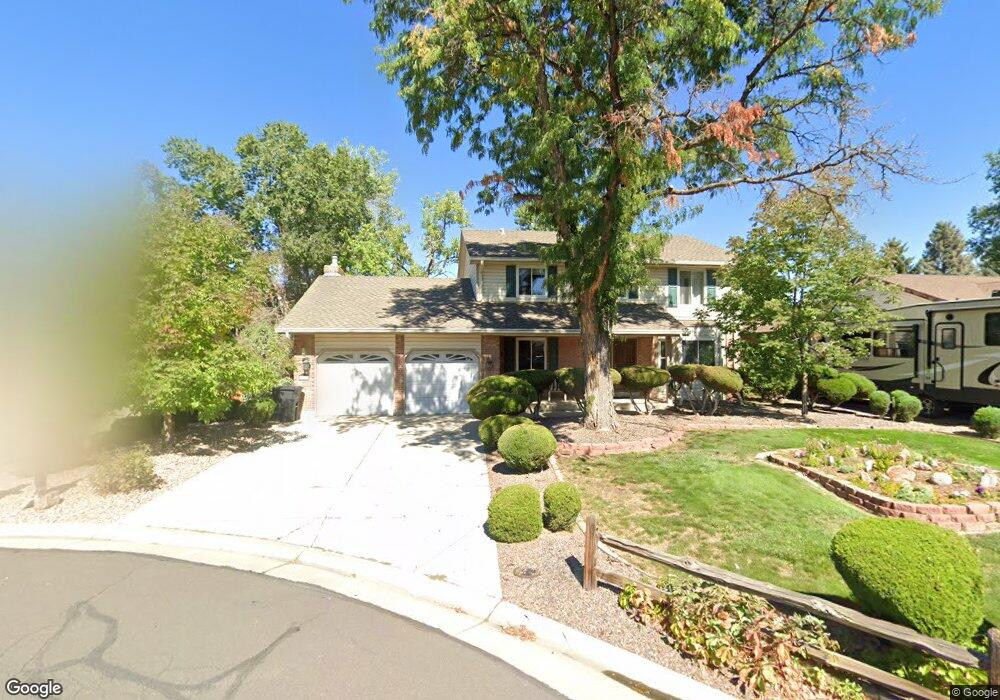
3779 E 133rd Cir Thornton, CO 80241
Estimated Value: $515,532 - $624,000
4
Beds
3
Baths
3,118
Sq Ft
$183/Sq Ft
Est. Value
About This Home
This home is located at 3779 E 133rd Cir, Thornton, CO 80241 and is currently estimated at $572,133, approximately $183 per square foot. 3779 E 133rd Cir is a home located in Adams County with nearby schools including Tarver Elementary School, Century Middle School, and Horizon High School.
Ownership History
Date
Name
Owned For
Owner Type
Purchase Details
Closed on
Jul 24, 2012
Sold by
Krening Patricia K
Bought by
Patricia K Krening Revocable Trust
Current Estimated Value
Purchase Details
Closed on
Mar 28, 2012
Sold by
The Bank Of New York Mellon
Bought by
Krening Patricia K
Home Financials for this Owner
Home Financials are based on the most recent Mortgage that was taken out on this home.
Original Mortgage
$166,800
Outstanding Balance
$113,883
Interest Rate
3.97%
Mortgage Type
New Conventional
Estimated Equity
$458,250
Purchase Details
Closed on
Dec 15, 2011
Sold by
Baca Violet F and Romero Tiffany V
Bought by
The Bank Of New York Mellon
Purchase Details
Closed on
Apr 28, 2006
Sold by
Skeels Gary L and Skeels Nancy L
Bought by
Romero Tiffany V and Baca Violet F
Home Financials for this Owner
Home Financials are based on the most recent Mortgage that was taken out on this home.
Original Mortgage
$219,200
Interest Rate
6.32%
Mortgage Type
Fannie Mae Freddie Mac
Create a Home Valuation Report for This Property
The Home Valuation Report is an in-depth analysis detailing your home's value as well as a comparison with similar homes in the area
Purchase History
| Date | Buyer | Sale Price | Title Company |
|---|---|---|---|
| Patricia K Krening Revocable Trust | -- | None Available | |
| Krening Patricia K | $208,500 | North American Title | |
| The Bank Of New York Mellon | -- | None Available | |
| Romero Tiffany V | $274,000 | Chicago Title Co |
Source: Public Records
Mortgage History
| Date | Status | Borrower | Loan Amount |
|---|---|---|---|
| Open | Krening Patricia K | $166,800 | |
| Previous Owner | Romero Tiffany V | $219,200 |
Source: Public Records
Tax History
| Year | Tax Paid | Tax Assessment Tax Assessment Total Assessment is a certain percentage of the fair market value that is determined by local assessors to be the total taxable value of land and additions on the property. | Land | Improvement |
|---|---|---|---|---|
| 2025 | $3,003 | $36,860 | $7,480 | $29,380 |
| 2024 | $3,003 | $33,880 | $6,880 | $27,000 |
| 2023 | $2,973 | $39,510 | $6,900 | $32,610 |
| 2022 | $3,023 | $27,440 | $7,090 | $20,350 |
| 2021 | $3,122 | $27,440 | $7,090 | $20,350 |
| 2020 | $3,021 | $27,080 | $7,290 | $19,790 |
| 2019 | $3,027 | $27,080 | $7,290 | $19,790 |
| 2018 | $2,761 | $23,990 | $7,200 | $16,790 |
| 2017 | $2,510 | $23,990 | $7,200 | $16,790 |
| 2016 | $2,192 | $20,400 | $4,140 | $16,260 |
| 2015 | $2,189 | $20,400 | $4,140 | $16,260 |
| 2014 | -- | $17,720 | $3,340 | $14,380 |
Source: Public Records
Map
Nearby Homes
- 4087 E 133rd Cir
- 13068 Harrison Dr
- 13064 Harrison Dr
- 13055 Harrison Dr
- 13064 Garfield Dr
- 13488 Monroe St
- 13222 Clermont Cir
- 13212 Clermont Cir
- 13521 Albion St
- 4061 E 129th Way
- 12992 Bellaire St
- 2973 E 133rd Ln
- 13364 Cherry Ct
- 12993 Birch Dr
- 0 Colorado Blvd
- 3670 E 128th Place
- 13604 Garfield St Unit E
- 2615 Signal Creek Dr
- 13406 Clayton St
- 12804 Harrison St
- 3809 E 133rd Cir
- 3739 E 133rd Cir
- 3786 E 133rd Ct
- 3806 E 133rd Ct
- 3738 E 133rd Cir
- 3839 E 133rd Cir
- 3788 E 133rd Cir
- 3836 E 133rd Ct
- 3808 E 133rd Cir
- 3869 E 133rd Cir
- 3692 E 133rd Ct
- 3866 E 133rd Ct
- 3838 E 133rd Cir
- 3726 E 133rd Ct
- 3690 E 133rd Cir
- 3899 E 133rd Cir
- 3807 E 133rd Ct
- 3777 E 133rd Ct
- 3868 E 133rd Cir
- 3682 E 133rd Ct
Your Personal Tour Guide
Ask me questions while you tour the home.