Estimated Value: $380,000 - $412,000
3
Beds
2
Baths
1,370
Sq Ft
$290/Sq Ft
Est. Value
About This Home
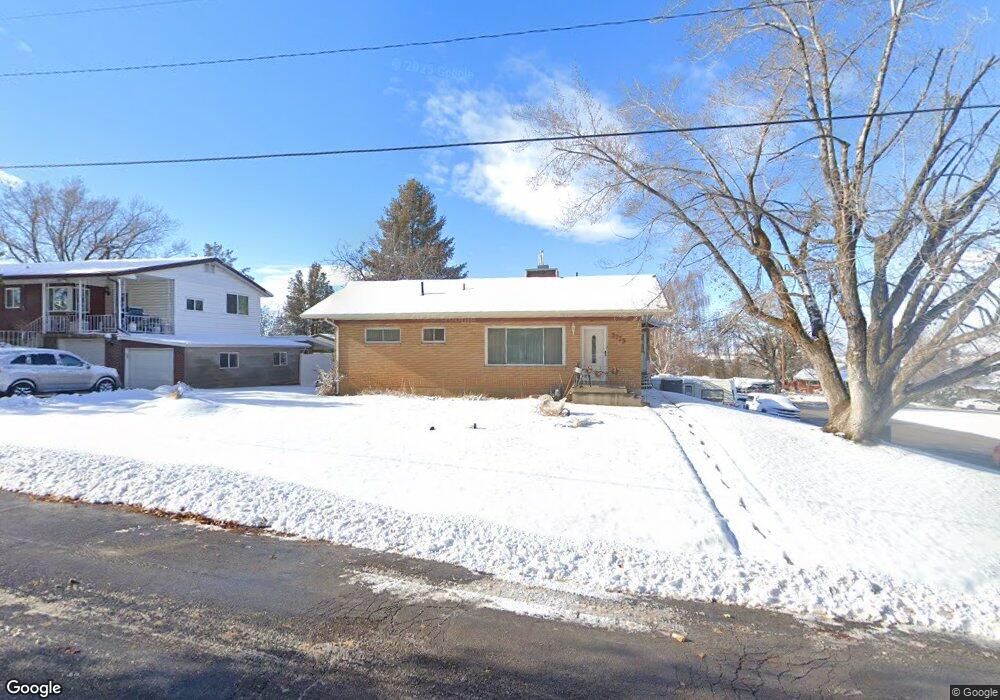
This home is located at 3779 S 2050 W, Roy, UT 84067 and is currently estimated at $397,860, approximately $290 per square foot. 3779 S 2050 W is a home located in Weber County with nearby schools including North Park School, Sand Ridge Junior High School, and Roy High School.
Ownership History
Date
Name
Owned For
Owner Type
Purchase Details
Closed on
Sep 3, 2024
Sold by
Property Seller Solutions Llc
Bought by
Pearce Coi
Current Estimated Value
Home Financials for this Owner
Home Financials are based on the most recent Mortgage that was taken out on this home.
Original Mortgage
$305,000
Outstanding Balance
$301,549
Interest Rate
6.87%
Mortgage Type
New Conventional
Estimated Equity
$96,311
Purchase Details
Closed on
Aug 5, 2024
Sold by
Boothe Duane L and Boothe Linda P
Bought by
Property Seller Solutions Llc
Home Financials for this Owner
Home Financials are based on the most recent Mortgage that was taken out on this home.
Original Mortgage
$305,000
Outstanding Balance
$301,549
Interest Rate
6.87%
Mortgage Type
New Conventional
Estimated Equity
$96,311
Purchase Details
Closed on
Oct 5, 2007
Sold by
Boothe Duane L and Boothe Linda P
Bought by
Boothe Duane L
Home Financials for this Owner
Home Financials are based on the most recent Mortgage that was taken out on this home.
Original Mortgage
$143,200
Interest Rate
6.4%
Mortgage Type
New Conventional
Create a Home Valuation Report for This Property
The Home Valuation Report is an in-depth analysis detailing your home's value as well as a comparison with similar homes in the area
Home Values in the Area
Average Home Value in this Area
Purchase History
| Date | Buyer | Sale Price | Title Company |
|---|---|---|---|
| Pearce Coi | -- | Real Advantage Title | |
| Property Seller Solutions Llc | -- | Advantage Title | |
| Boothe Duane L | -- | Eagle Pointe Title Ins A | |
| Boothe Duane L | -- | Eagle Pointe Title Ins A |
Source: Public Records
Mortgage History
| Date | Status | Borrower | Loan Amount |
|---|---|---|---|
| Open | Property Seller Solutions Llc | $305,000 | |
| Previous Owner | Boothe Duane L | $143,200 | |
| Previous Owner | Boothe Duane L | $17,900 |
Source: Public Records
Tax History Compared to Growth
Tax History
| Year | Tax Paid | Tax Assessment Tax Assessment Total Assessment is a certain percentage of the fair market value that is determined by local assessors to be the total taxable value of land and additions on the property. | Land | Improvement |
|---|---|---|---|---|
| 2025 | $2,456 | $386,481 | $116,671 | $269,810 |
| 2024 | $2,397 | $380,000 | $116,771 | $263,229 |
| 2023 | $2,178 | $188,650 | $60,801 | $127,849 |
| 2022 | $2,214 | $198,000 | $52,633 | $145,367 |
| 2021 | $1,804 | $264,000 | $65,640 | $198,360 |
| 2020 | $1,723 | $232,000 | $65,640 | $166,360 |
| 2019 | $1,617 | $204,000 | $40,556 | $163,444 |
| 2018 | $1,463 | $172,000 | $35,453 | $136,547 |
| 2017 | $1,400 | $154,000 | $33,477 | $120,523 |
| 2016 | $1,295 | $76,041 | $13,496 | $62,545 |
| 2015 | $1,148 | $68,154 | $16,796 | $51,358 |
| 2014 | $1,076 | $62,408 | $16,796 | $45,612 |
Source: Public Records
Map
Nearby Homes
- 2096 W 3950 S
- 3923 S 1975 W Unit 15
- 3854 S 1925 W
- 2050 W 4000 S
- 2070 W 4000 S
- 3965 S 2225 W
- 1910 W 3920 S
- 1959 3985 St S Unit 2
- 3860 Midland Dr Unit C10
- 3860 Midland Dr Unit B32
- 3800 S 1900 W Unit 28
- 3800 S 1900 W Unit 64
- 3800 S 1900 W Unit 66
- 3800 S 1900 W Unit 89
- 3800 S 1900 W Unit 295
- 3800 S 1900 W Unit 241
- 3800 S 1900 W Unit 133
- 3800 S 1900 W Unit 72
- 4073 S 2175 W
- 4110 S 2275 W