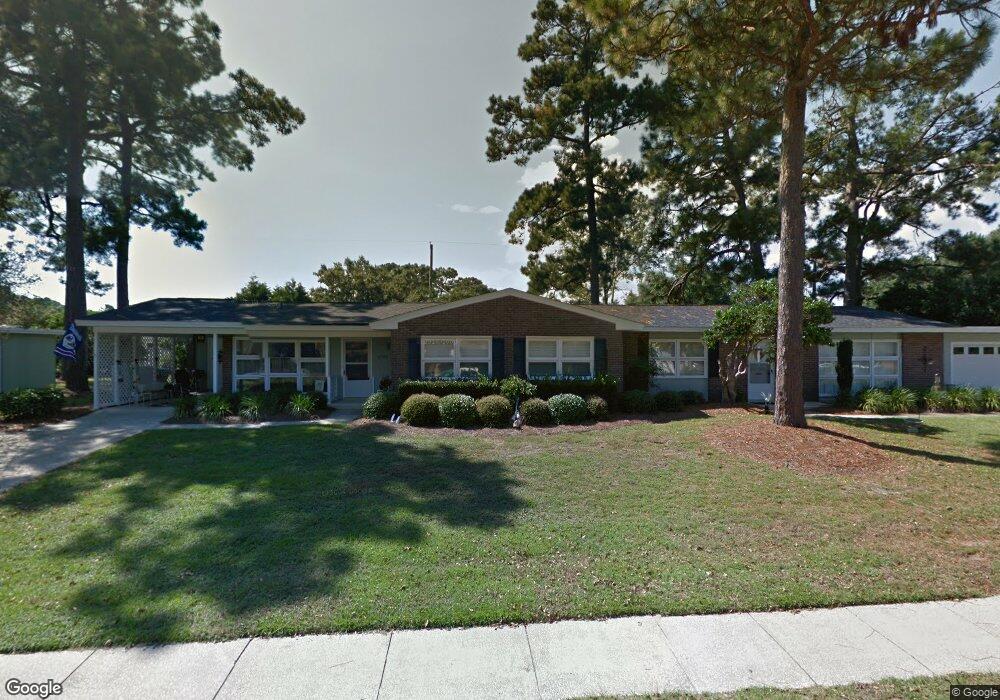
3779 Vine St Myrtle Beach, SC 29577
Seagate Village Neighborhood
3
Beds
2
Baths
1,221
Sq Ft
--
Built
About This Home
This home is located at 3779 Vine St, Myrtle Beach, SC 29577. 3779 Vine St is a home located in Horry County with nearby schools including Myrtle Beach Child Development Center, Myrtle Beach Primary School, and Myrtle Beach Middle School.
Create a Home Valuation Report for This Property
The Home Valuation Report is an in-depth analysis detailing your home's value as well as a comparison with similar homes in the area
Home Values in the Area
Average Home Value in this Area
Tax History
| Year | Tax Paid | Tax Assessment Tax Assessment Total Assessment is a certain percentage of the fair market value that is determined by local assessors to be the total taxable value of land and additions on the property. | Land | Improvement |
|---|---|---|---|---|
| 2025 | $322 | $0 | $0 | $0 |
| 2024 | $322 | $15,954 | $0 | $15,954 |
| 2023 | $322 | $15,225 | $0 | $15,225 |
| 2021 | $265 | $15,225 | $0 | $15,225 |
| 2020 | $229 | $15,225 | $0 | $15,225 |
| 2019 | $221 | $15,225 | $0 | $15,225 |
| 2018 | $176 | $11,130 | $0 | $11,130 |
| 2017 | $171 | $11,130 | $0 | $11,130 |
| 2016 | -- | $11,130 | $0 | $11,130 |
| 2015 | $321 | $4,240 | $0 | $4,240 |
| 2014 | $289 | $4,240 | $0 | $4,240 |
Source: Public Records
Map
Nearby Homes
- 3766 Spruce Dr Unit 3766
- 539 Redwood Ave Unit 539
- 536 Redwood Ave Unit 536
- 3752 Tea Rose St Unit 3752
- 1525 Capella Ln
- 3645 Cypress Cir Unit 3645
- 1657 Ursa Major Dr
- 1661 Ursa Major Dr
- 1517 Pisces Ln
- 1672 Ursa Major Dr
- 783 Walnut Ave Unit 783
- 1672 Ursa Minor Dr
- 2737 Capricorn Dr
- 1529 Virgo Ln
- 1664 Cygnus Dr
- 857 Pampas Dr Unit C
- 2729 Libra Dr
- 3676 Spruce Dr Unit 3676
- 1395 Mcmaster Dr
- 3545 Elderberry St Unit 3545
- 3783 Vine St
- 3783 Vine St Unit 3779 Seagate Village
- 3775 Vine St Unit Seagate Village
- 3775 Vine St
- 3771 Vine St Unit 3771
- 3802 Spruce Dr Unit 3802
- 3782 Vine St Unit 3782
- 3778 Vine St Unit 3778
- 3774 Vine St Unit Seagate Village 377
- 3774 Vine St Unit 3774
- 3791 Vine St Unit 3791
- 3787 Vine St Unit 3787
- 3770 Vine St Unit Seagate Village
- 3770 Vine St Unit 3770
- 529 Swallow Ave Unit 529
- 525 Swallow Ave Unit 525
- 3790 Vine St Unit 3790
- 3818 Spruce Dr Unit 3818
- 3786 Vine St Unit 3786
- 3757 Otter St Unit 3780