W
Landlord's Agent in 2018
Wendy Wang
Downtown Boston Real Estate, LLC
(617) 959-5368
45 Total Sales


Estimated Value: $710,000 - $786,574
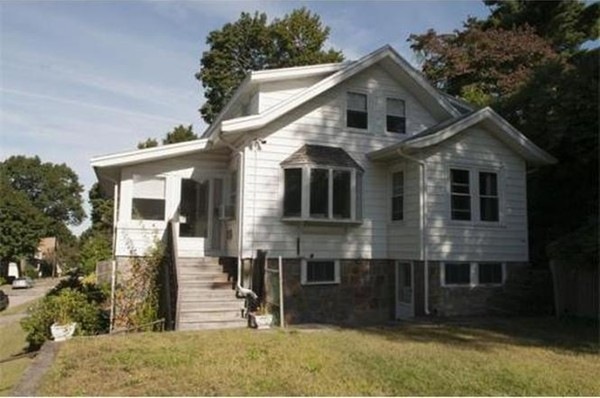
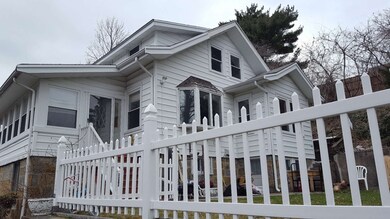
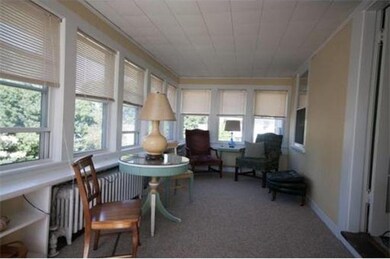
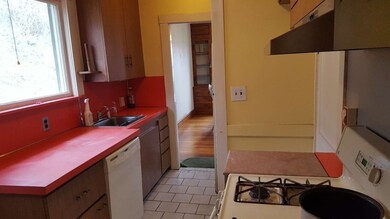
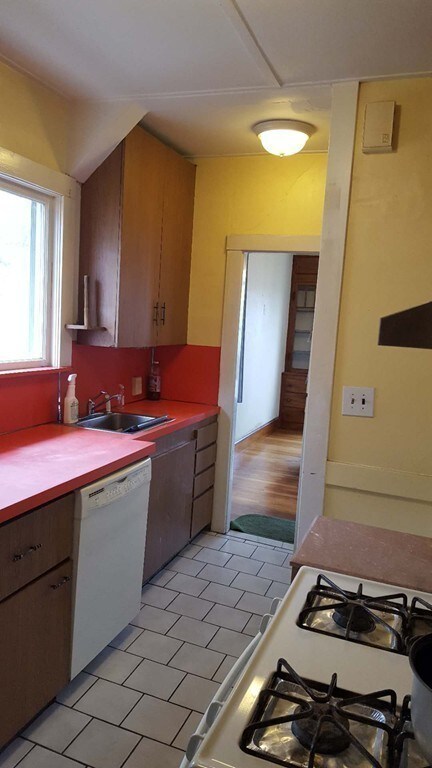
Location! Location! Location! Walking distance to Wollaston T station. Unit feature hardwood flooring and large eat-in kitchen. 5 spacious bedrooms 2 full baths. Washer and dryer in the basement.
Home Type
Single Family
Est. Annual Taxes
$7,883
Year Built
1925
Lot Details
0
| Date | Status | Borrower | Loan Amount |
|---|---|---|---|
| Closed | Han Yun Y | $231,700 |
| Date | Event | Price | Change | Sq Ft Price |
|---|---|---|---|---|
| 05/29/2018 05/29/18 | Rented | $2,500 | 0.0% | -- |
| 05/23/2018 05/23/18 | Under Contract | -- | -- | -- |
| 04/10/2018 04/10/18 | For Rent | $2,500 | 0.0% | -- |
| 11/21/2013 11/21/13 | Sold | $331,000 | +0.8% | $226 / Sq Ft |
| 09/19/2013 09/19/13 | Pending | -- | -- | -- |
| 09/11/2013 09/11/13 | For Sale | $328,500 | -- | $224 / Sq Ft |
| Year | Tax Paid | Tax Assessment Tax Assessment Total Assessment is a certain percentage of the fair market value that is determined by local assessors to be the total taxable value of land and additions on the property. | Land | Improvement |
|---|---|---|---|---|
| 2025 | $7,883 | $683,700 | $384,000 | $299,700 |
| 2024 | $7,739 | $686,700 | $384,000 | $302,700 |
| 2023 | $7,219 | $648,600 | $365,800 | $282,800 |
| 2022 | $7,187 | $599,900 | $322,000 | $277,900 |
| 2021 | $6,956 | $573,000 | $322,000 | $251,000 |
| 2020 | $7,084 | $569,900 | $322,000 | $247,900 |
| 2019 | $6,520 | $519,500 | $301,000 | $218,500 |
| 2018 | $6,178 | $463,100 | $261,300 | $201,800 |
| 2017 | $6,316 | $445,700 | $273,700 | $172,000 |
| 2016 | $5,814 | $404,900 | $244,400 | $160,500 |
| 2015 | $5,402 | $370,000 | $222,200 | $147,800 |
| 2014 | $5,081 | $341,900 | $215,500 | $126,400 |
W
Landlord's Agent in 2018
Wendy Wang
Downtown Boston Real Estate, LLC
(617) 959-5368
45 Total Sales
k
Tenant's Agent in 2018
ken peng
Downtown Boston Real Estate, LLC
(617) 680-7392
34 Total Sales

Seller's Agent in 2013
Kara Willis
Fathom Realty MA
(617) 584-3662
33 Total Sales
Buyer's Agent in 2013
Chris Yang
Keller Williams Realty Boston South West
(781) 414-9550
12 in this area
278 Total Sales
Source: MLS Property Information Network (MLS PIN)
MLS Number: 72332350
APN: QUIN-005175-000015-A000000
Disclaimer: Certain information contained herein is derived from information provided by parties other than Homes.com. All information provided is deemed reliable, but is not guaranteed to be accurate and should be independently verified.
![]() The property listing data and information, or the Images, set forth herein were provided to MLS Property Information Network, Inc. from third party sources, including sellers, lessors and public records, and were compiled by MLS Property Information Network, Inc. The property listing data and information, and the Images, are for the personal, non-commercial use of consumers having a good faith interest in purchasing or leasing listed properties of the type displayed to them and may not be used for any purpose other than to identify prospective properties which such consumers may have a good faith interest in purchasing or leasing. MLS Property Information Network, Inc. and its subscribers disclaim any and all representations and warranties as to the accuracy of the property listing data and information, or as to the accuracy of any of the Images, set forth herein.
The property listing data and information, or the Images, set forth herein were provided to MLS Property Information Network, Inc. from third party sources, including sellers, lessors and public records, and were compiled by MLS Property Information Network, Inc. The property listing data and information, and the Images, are for the personal, non-commercial use of consumers having a good faith interest in purchasing or leasing listed properties of the type displayed to them and may not be used for any purpose other than to identify prospective properties which such consumers may have a good faith interest in purchasing or leasing. MLS Property Information Network, Inc. and its subscribers disclaim any and all representations and warranties as to the accuracy of the property listing data and information, or as to the accuracy of any of the Images, set forth herein.