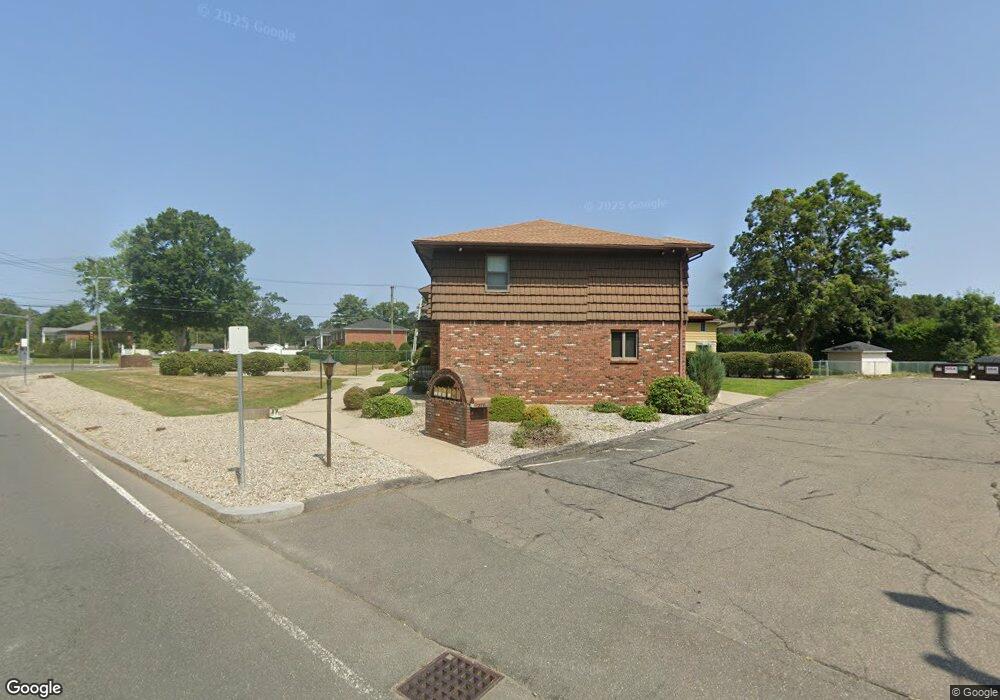
378 Chapin St Ludlow, MA 01056
Estimated Value: $211,000 - $287,000
2
Beds
2
Baths
1,197
Sq Ft
$200/Sq Ft
Est. Value
About This Home
This home is located at 378 Chapin St, Ludlow, MA 01056 and is currently estimated at $239,000, approximately $199 per square foot. 378 Chapin St is a home located in Hampden County with nearby schools including East Street Elementary School, Chapin Street Elementary School, and Paul R. Baird Middle School.
Ownership History
Date
Name
Owned For
Owner Type
Purchase Details
Closed on
Mar 23, 2023
Sold by
Leitao Christopher and Leitao Bryant
Bought by
Francisco Leitao Ret
Current Estimated Value
Purchase Details
Closed on
Jun 19, 2003
Sold by
Leitao Maria G
Bought by
Leitao Manuel A
Purchase Details
Closed on
Oct 23, 1990
Sold by
Myers Wanda R
Bought by
Leitao Francisco
Home Financials for this Owner
Home Financials are based on the most recent Mortgage that was taken out on this home.
Original Mortgage
$100,000
Interest Rate
10.14%
Mortgage Type
Purchase Money Mortgage
Create a Home Valuation Report for This Property
The Home Valuation Report is an in-depth analysis detailing your home's value as well as a comparison with similar homes in the area
Home Values in the Area
Average Home Value in this Area
Purchase History
| Date | Buyer | Sale Price | Title Company |
|---|---|---|---|
| Francisco Leitao Ret | $180,000 | None Available | |
| Leitao Manuel A | -- | -- | |
| Leitao Francisco | $195,000 | -- |
Source: Public Records
Mortgage History
| Date | Status | Borrower | Loan Amount |
|---|---|---|---|
| Previous Owner | Leitao Francisco | $600,000 | |
| Previous Owner | Leitao Francisco | $100,000 |
Source: Public Records
Tax History
| Year | Tax Paid | Tax Assessment Tax Assessment Total Assessment is a certain percentage of the fair market value that is determined by local assessors to be the total taxable value of land and additions on the property. | Land | Improvement |
|---|---|---|---|---|
| 2025 | $3,375 | $194,500 | $0 | $194,500 |
| 2024 | $3,412 | $188,600 | $0 | $188,600 |
| 2023 | $3,406 | $174,600 | $0 | $174,600 |
| 2022 | $3,240 | $162,100 | $0 | $162,100 |
| 2021 | $1,538 | $152,800 | $0 | $152,800 |
| 2020 | $3,077 | $149,200 | $0 | $149,200 |
| 2019 | $2,820 | $142,300 | $0 | $142,300 |
| 2018 | $2,642 | $139,000 | $0 | $139,000 |
| 2017 | $2,579 | $139,200 | $0 | $139,200 |
| 2016 | $2,477 | $136,600 | $0 | $136,600 |
| 2015 | $2,343 | $135,500 | $0 | $135,500 |
Source: Public Records
Map
Nearby Homes
- 25 Dale St
- 374 East St
- 31 Greenwich St
- 259 Prospect St
- 37 Franklin St
- 59 Prospect St
- 162 Highland Ave
- 125 Pondview Dr
- 70 Sroka Ln
- 287 East St
- 308 Miller St Unit 79
- 308 Miller St Unit 78
- 308 Miller St Unit 6
- 229 Miller St Unit F-13
- 229 Miller St Unit C-1
- 229 Miller St Unit E-6
- 229 Miller St Unit 3 G
- 63 Oak St
- 84 Chapin Greene Dr
- 517 Ideal Ln Unit 401
Your Personal Tour Guide
Ask me questions while you tour the home.