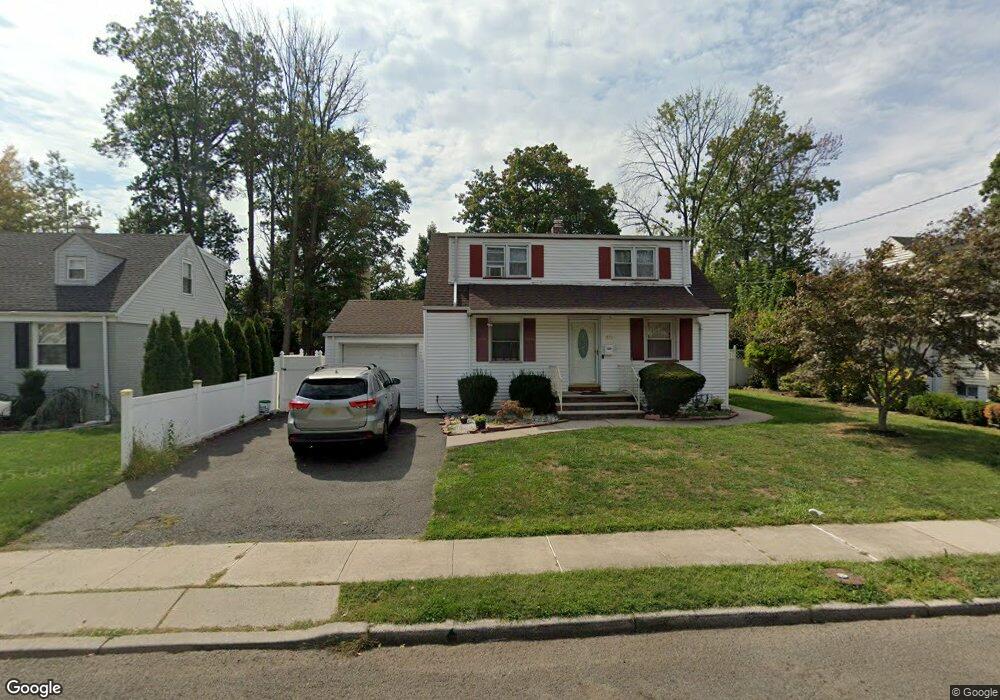
378 Douglas Rd Roselle, NJ 07203
Estimated Value: $403,192 - $514,000
Studio
--
Bath
1,440
Sq Ft
$325/Sq Ft
Est. Value
About This Home
This home is located at 378 Douglas Rd, Roselle, NJ 07203 and is currently estimated at $468,548, approximately $325 per square foot. 378 Douglas Rd is a home located in Union County with nearby schools including Washington Elementary School, Grace Wilday Junior High School, and Leonard V. Moore Middle School.
Ownership History
Date
Name
Owned For
Owner Type
Purchase Details
Closed on
Aug 31, 2001
Sold by
Brown Shawn and Brown Andrea
Bought by
Mytil Yolande
Current Estimated Value
Home Financials for this Owner
Home Financials are based on the most recent Mortgage that was taken out on this home.
Original Mortgage
$141,592
Outstanding Balance
$55,173
Interest Rate
6.98%
Mortgage Type
FHA
Estimated Equity
$413,375
Purchase Details
Closed on
Jan 21, 1998
Sold by
Brown Andrea J
Bought by
Brown Shawn and Brown Andrea
Purchase Details
Closed on
Jul 22, 1997
Sold by
Swanson Keith J and Swanson Monika H
Bought by
Brown Andrea J
Home Financials for this Owner
Home Financials are based on the most recent Mortgage that was taken out on this home.
Original Mortgage
$104,141
Interest Rate
7.55%
Mortgage Type
FHA
Create a Home Valuation Report for This Property
The Home Valuation Report is an in-depth analysis detailing your home's value as well as a comparison with similar homes in the area
Home Values in the Area
Average Home Value in this Area
Purchase History
| Date | Buyer | Sale Price | Title Company |
|---|---|---|---|
| Mytil Yolande | $159,900 | New Jersey Title Insurance C | |
| Brown Shawn | -- | Chicago Title Insurance Co | |
| Brown Andrea J | $105,000 | -- |
Source: Public Records
Mortgage History
| Date | Status | Borrower | Loan Amount |
|---|---|---|---|
| Open | Mytil Yolande | $141,592 | |
| Previous Owner | Brown Andrea J | $104,141 |
Source: Public Records
Tax History
| Year | Tax Paid | Tax Assessment Tax Assessment Total Assessment is a certain percentage of the fair market value that is determined by local assessors to be the total taxable value of land and additions on the property. | Land | Improvement |
|---|---|---|---|---|
| 2025 | $10,173 | $117,000 | $71,200 | $45,800 |
| 2024 | $9,918 | $117,000 | $71,200 | $45,800 |
| 2023 | $9,918 | $117,000 | $71,200 | $45,800 |
| 2022 | $9,987 | $117,000 | $71,200 | $45,800 |
| 2021 | $9,927 | $117,000 | $71,200 | $45,800 |
| 2020 | $9,896 | $117,000 | $71,200 | $45,800 |
| 2019 | $9,770 | $117,000 | $71,200 | $45,800 |
| 2018 | $9,716 | $117,000 | $71,200 | $45,800 |
| 2017 | $9,664 | $117,000 | $71,200 | $45,800 |
| 2016 | $9,451 | $117,000 | $71,200 | $45,800 |
| 2015 | $9,450 | $117,000 | $71,200 | $45,800 |
| 2014 | $9,187 | $117,000 | $71,200 | $45,800 |
Source: Public Records
Map
Nearby Homes
- 382 Douglas Rd
- 400 Douglas Rd
- 1709 Wood Ave Unit A1
- 574 Sherman Ave
- 1611 Orchard Terrace
- 1210 Orchard Terrace
- 63 Elmwood Terrace
- 224 Swarthmore Rd
- 1 Furber Ave
- 909 Seymour Ave
- 12 Drapkin Ave
- 2513 N Wood Ave
- 37 Raritan Rd
- 1502 Sunnyfield Dr
- 925 Summit St
- 14 Colonial Rd
- 229 Hillcrest Terrace
- 812 Washington Ave
- 540 W 7th Ave
- 2611 N Wood Ave
- 374 Douglas Rd
- 386 Douglas Rd
- 370 Douglas Rd
- 379 Douglas Rd
- 383 Douglas Rd
- 375 Douglas Rd
- 514 Brooklawn Ave
- 514 Brooklawn Ave Unit B1
- 514 Brooklawn Ave Unit A1
- 514 Brooklawn Ave Unit B2
- 514 Brooklawn Ave Unit A2
- 387 Douglas Rd
- 387 Douglas Rd Unit 1
- 390 Douglas Rd
- 506 Brooklawn Ave
- 1607 Wood Ave Apt H2 Unit H2
- 1609 Wood Ave Unit K2
- 1609 Wood Ave Unit J2
- 1609 Wood Ave Unit K1
- 1609 Wood Ave Unit J1
Your Personal Tour Guide
Ask me questions while you tour the home.