
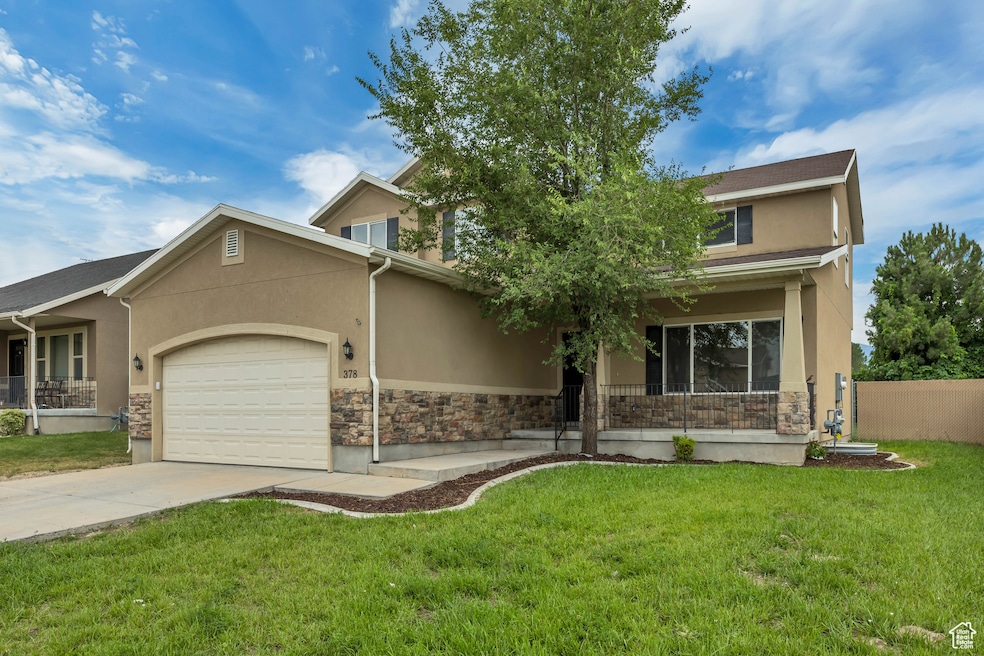
378 E 1720 N Tooele, UT 84074
Estimated payment $2,709/month
Total Views
720
4
Beds
2.5
Baths
3,000
Sq Ft
$150
Price per Sq Ft
Highlights
- RV or Boat Parking
- Mountain View
- 1 Fireplace
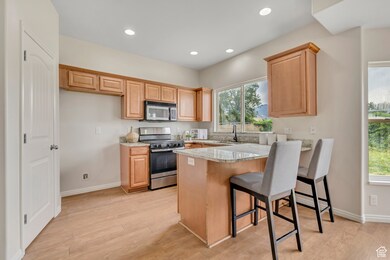
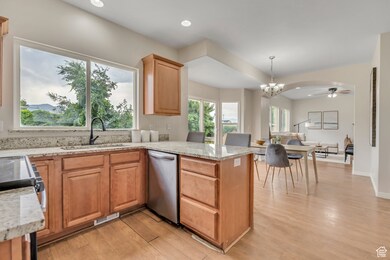
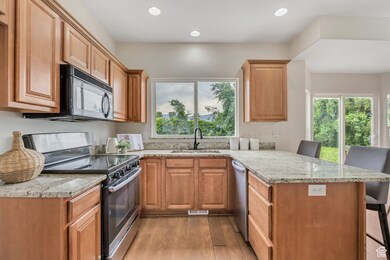
- Updated Kitchen
- Secluded Lot
- No HOA
About This Home
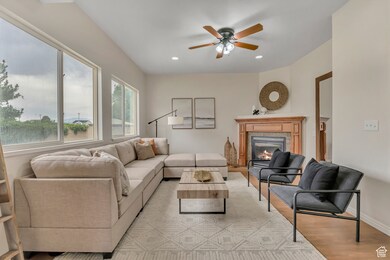
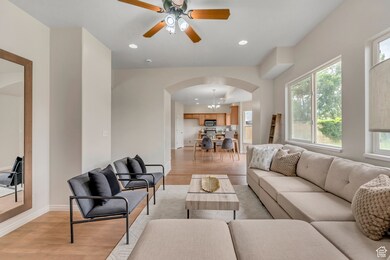
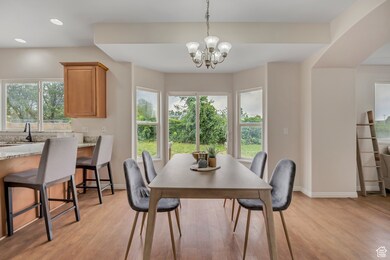
Step into this beautifully updated two story home featuring fresh paint and brand-new carpet throughout! The open concept layout boasts a spacious kitchen, generous dining area, and a warm family room centered around a cozy fireplace perfect for entertaining or relaxing evenings in. Upstairs, you'll find a huge master ensuite with soaring vaulted ceilings, a large bathroom offering a separate soaking tub and shower, and ample closet space. Situated in an unbeatable location, the backyard opens directly to the school grounds, providing both privacy and convenience. This is the perfect blend of comfort, charm, and location! VACANT AND EASY TO SHOW!
Home Details
Home Type
- Single Family
Est. Annual Taxes
- $3,159
Year Built
- Built in 2006
Lot Details
- 6,970 Sq Ft Lot
- Landscaped
- Secluded Lot
Parking
- 2 Car Attached Garage
- 6 Open Parking Spaces
- RV or Boat Parking
Home Design
- Stone Siding
- Stucco
Interior Spaces
- 3,000 Sq Ft Home
- 3-Story Property
- 1 Fireplace
- Double Pane Windows
- Mountain Views
- Basement Fills Entire Space Under The House
Kitchen
- Updated Kitchen
- Microwave
- Disposal
Flooring
- Carpet
- Tile
Bedrooms and Bathrooms
- 4 Bedrooms
Schools
- Copper Canyon Elementary School
- Tooele Middle School
- Tooele High School
Utilities
- Forced Air Heating and Cooling System
- Natural Gas Connected
Community Details
- No Home Owners Association
- Canyon Village Subdivision
Listing and Financial Details
- Assessor Parcel Number 15-068-0-0012
Map
Create a Home Valuation Report for This Property
The Home Valuation Report is an in-depth analysis detailing your home's value as well as a comparison with similar homes in the area
Home Values in the Area
Average Home Value in this Area
Tax History
| Year | Tax Paid | Tax Assessment Tax Assessment Total Assessment is a certain percentage of the fair market value that is determined by local assessors to be the total taxable value of land and additions on the property. | Land | Improvement |
|---|---|---|---|---|
| 2024 | $3,159 | $241,131 | $55,000 | $186,131 |
| 2023 | $3,159 | $271,254 | $52,383 | $218,871 |
| 2022 | $3,231 | $278,006 | $51,906 | $226,100 |
| 2021 | $2,705 | $194,686 | $20,763 | $173,923 |
| 2020 | $2,564 | $320,093 | $37,750 | $282,343 |
| 2019 | $2,497 | $306,648 | $37,750 | $268,898 |
| 2018 | $2,301 | $267,880 | $40,000 | $227,880 |
| 2017 | $1,878 | $259,486 | $35,000 | $224,486 |
| 2016 | $1,531 | $126,613 | $19,250 | $107,363 |
| 2015 | $1,531 | $111,345 | $0 | $0 |
| 2014 | -- | $111,345 | $0 | $0 |
Source: Public Records
Property History
| Date | Event | Price | Change | Sq Ft Price |
|---|---|---|---|---|
| 07/28/2025 07/28/25 | Pending | -- | -- | -- |
| 07/17/2025 07/17/25 | For Sale | $449,900 | -- | $150 / Sq Ft |
Source: UtahRealEstate.com
Purchase History
| Date | Type | Sale Price | Title Company |
|---|---|---|---|
| Warranty Deed | -- | Real Advantage Title | |
| Warranty Deed | -- | Meridian Title | |
| Warranty Deed | -- | Inwest Title Services Inc | |
| Quit Claim Deed | -- | None Available | |
| Interfamily Deed Transfer | -- | B & D Title Co | |
| Interfamily Deed Transfer | -- | B & D Title Co | |
| Interfamily Deed Transfer | -- | Charger Title | |
| Warranty Deed | -- | Charger Title | |
| Warranty Deed | -- | Merrill Title Company | |
| Warranty Deed | -- | Merrill Title Co |
Source: Public Records
Mortgage History
| Date | Status | Loan Amount | Loan Type |
|---|---|---|---|
| Previous Owner | $248,150 | New Conventional | |
| Previous Owner | $25,000 | Commercial | |
| Previous Owner | $199,920 | Commercial | |
| Previous Owner | $19,980 | Commercial | |
| Previous Owner | $273,774 | FHA | |
| Previous Owner | $271,735 | FHA | |
| Previous Owner | $241,340 | New Conventional |
Source: Public Records
Similar Homes in Tooele, UT
Source: UtahRealEstate.com
MLS Number: 2099438
APN: 15-068-0-0012
Disclaimer: Certain information contained herein is derived from information provided by parties other than Homes.com. All information provided is deemed reliable, but is not guaranteed to be accurate and should be independently verified.
![]() IDX information is provided exclusively for consumers’ personal, non-commercial use, that it may not be used for any purpose other than to identify prospective properties consumers may be interested in purchasing, and that the data is deemed reliable but is not guaranteed accurate by the MLS. Licensor is only providing the MLS Content and not other sources of data provided in the Product.
IDX information is provided exclusively for consumers’ personal, non-commercial use, that it may not be used for any purpose other than to identify prospective properties consumers may be interested in purchasing, and that the data is deemed reliable but is not guaranteed accurate by the MLS. Licensor is only providing the MLS Content and not other sources of data provided in the Product.
Based on information from the Wasatch Front Regional Multiple Listing Service, Inc.. All data, including all measurements and calculations of area, is obtained from various sources and has not been, and will not be, verified by broker or the MLS. All information should be independently reviewed and verified for accuracy. Properties may or may not be listed by the office/agent presenting the information.
Nearby Homes
- 1737 N Broadway Ave
- 1912 N 370 E
- 1917 N Blue Iris Ave Unit 1090
- 1454 N 420 E
- 1578 N 210 E
- 1182 N Berra Blvd
- 1934 N Ten Hens Ave Unit 1140
- 1545 N 210 E
- Millbrook Plan at Western Acres
- Oakridge Plan at Western Acres
- 215 E Serenity Ave Unit 1208
- 1716 N 150 E
- 1397 N 550 E
- 179 Green Pines Ave
- 632 E 1480 N
- 1273 N 490 E
- 1313 N 590 E
- 1236 N 600 E
- 212 Aparicio Dr
- 1789 N Aaron Dr