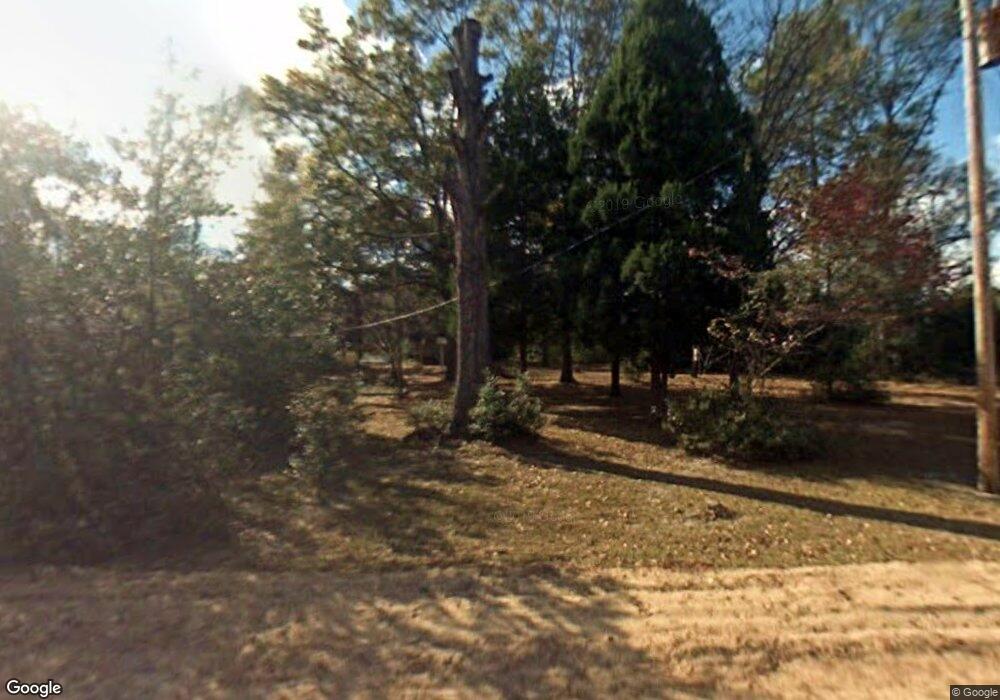
378 Frank Hendry Rd Ellabell, GA 31308
Estimated Value: $295,000 - $453,000
3
Beds
2
Baths
1,828
Sq Ft
$193/Sq Ft
Est. Value
About This Home
This home is located at 378 Frank Hendry Rd, Ellabell, GA 31308 and is currently estimated at $352,552, approximately $192 per square foot. 378 Frank Hendry Rd is a home located in Bryan County with nearby schools including Lanier Primary School, Bryan County Elementary School, and Bryan County Middle School.
Ownership History
Date
Name
Owned For
Owner Type
Purchase Details
Closed on
Nov 11, 2004
Sold by
Lee Virginia H
Bought by
Sims Devin and Sims Dustin
Current Estimated Value
Purchase Details
Closed on
Feb 1, 1993
Bought by
Lee Virginia H
Create a Home Valuation Report for This Property
The Home Valuation Report is an in-depth analysis detailing your home's value as well as a comparison with similar homes in the area
Home Values in the Area
Average Home Value in this Area
Purchase History
| Date | Buyer | Sale Price | Title Company |
|---|---|---|---|
| Sims Devin | -- | -- | |
| Sims Devin | -- | -- | |
| Lee Virginia H | -- | -- |
Source: Public Records
Tax History Compared to Growth
Tax History
| Year | Tax Paid | Tax Assessment Tax Assessment Total Assessment is a certain percentage of the fair market value that is determined by local assessors to be the total taxable value of land and additions on the property. | Land | Improvement |
|---|---|---|---|---|
| 2024 | $2,066 | $81,464 | $6,360 | $75,104 |
| 2023 | $2,066 | $59,580 | $6,360 | $53,220 |
| 2022 | $1,540 | $58,100 | $6,360 | $51,740 |
| 2021 | $1,467 | $54,420 | $6,360 | $48,060 |
| 2020 | $1,347 | $54,140 | $6,080 | $48,060 |
| 2019 | $1,450 | $53,184 | $6,080 | $47,104 |
| 2018 | $1,590 | $49,584 | $6,080 | $43,504 |
| 2017 | $300 | $48,992 | $6,080 | $42,912 |
| 2016 | $300 | $48,032 | $6,080 | $41,952 |
| 2015 | $300 | $47,432 | $6,080 | $41,352 |
| 2014 | $300 | $47,504 | $6,080 | $41,424 |
Source: Public Records
Map
Nearby Homes
- 8303 Us Hwy 280
- 58 Westhampton Dr
- 32 Sheridan Ct
- 38 Westhampton Dr
- 145 Worthington Dr
- 0 Ga 204 Hwy Unit 328802
- 628 Toni Branch Rd
- 0 Us 80 Hwy Unit 322296
- 589 Old Mill Creek Rd
- 397 Pine Ridge Dr
- 725 Blue Gill Rd
- 58 Pine Ridge Ct
- 100 Hallelujah Trail
- 190 Freeman Dr
- 89 Wade Carter Rd
- 105 Creekside Cir
- 8 Palmetto Dr
- 50 & 100 Hallelujah Trail
- 2391 Homestead Dr
- 285 Creekside Cir
- 450 Frank Hendry Rd
- 382 Frank Hendry Rd
- 509 Frank Hendry Rd
- 216 Frank Hendry Rd
- 551 Frank Hendry Rd
- 205 Frank Hendry Rd
- 564 Black Creek Church Rd
- 159 Frank Hendry Rd
- 634 Frank Hendry Rd
- 592 Frank Hendry Rd
- 555 Mill Creek Church Rd
- 670 Frank Hendry Rd
- 742 Black Creek Church Rd
- 240 Church of God Rd
- 725 Black Creek Church Rd
- 729 Black Creek Church Rd
- 525 Rambling Creek Rd
- 8382 U S 280
- 33 Shumantown Rd
- 540 Rambling Creek Rd