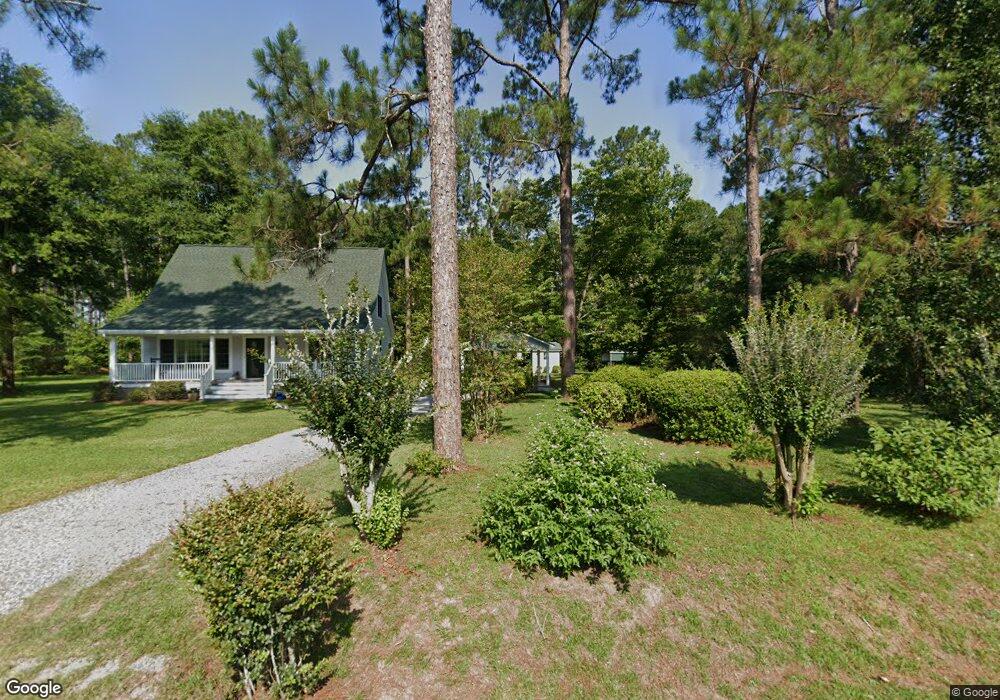
378 Lakeshore Way Cordele, GA 31015
Estimated Value: $350,304 - $620,000
4
Beds
2
Baths
1,770
Sq Ft
$251/Sq Ft
Est. Value
About This Home
This home is located at 378 Lakeshore Way, Cordele, GA 31015 and is currently estimated at $445,076, approximately $251 per square foot. 378 Lakeshore Way is a home located in Crisp County with nearby schools including Crisp County Elementary School, Crisp County Primary School, and Crisp County Middle School.
Ownership History
Date
Name
Owned For
Owner Type
Purchase Details
Closed on
Jul 3, 2019
Sold by
Lane Stephen E
Bought by
Lane Stephen E and Lane Marietta C
Current Estimated Value
Purchase Details
Closed on
Mar 28, 2003
Sold by
Treadaway Gary
Bought by
Lane Stephen E
Purchase Details
Closed on
Mar 7, 2003
Sold by
Haire William and Haire Den
Bought by
Lane Stephen E
Purchase Details
Closed on
Aug 22, 1997
Sold by
Kraepel Randall +
Bought by
Haire William and Haire Den
Purchase Details
Closed on
Apr 28, 1995
Sold by
Klatt Ludwig and Klatt Norma
Bought by
Treadaway Gary
Purchase Details
Closed on
Jun 2, 1983
Sold by
Mann Mann A and Mann Olive
Bought by
Kraepel Randall +
Purchase Details
Closed on
Aug 9, 1978
Sold by
Ollis Frank and Ollis Jodie
Bought by
Klatt Ludwig and Klatt Norma
Purchase Details
Closed on
Dec 30, 1977
Bought by
Ollis Frank and Ollis Jodie
Purchase Details
Closed on
Sep 10, 1974
Bought by
Mann Mann A and Mann Olive
Create a Home Valuation Report for This Property
The Home Valuation Report is an in-depth analysis detailing your home's value as well as a comparison with similar homes in the area
Home Values in the Area
Average Home Value in this Area
Purchase History
| Date | Buyer | Sale Price | Title Company |
|---|---|---|---|
| Lane Stephen E | -- | -- | |
| Lane Marietta C | -- | -- | |
| Lane Stephen E | $25,000 | -- | |
| Lane Stephen E | $105,000 | -- | |
| Haire William | $12,500 | -- | |
| Treadaway Gary | $25,000 | -- | |
| Kraepel Randall + | $15,000 | -- | |
| Klatt Ludwig | $2,000 | -- | |
| Ollis Frank | $6,000 | -- | |
| Mann Mann A | $1,000 | -- |
Source: Public Records
Tax History Compared to Growth
Tax History
| Year | Tax Paid | Tax Assessment Tax Assessment Total Assessment is a certain percentage of the fair market value that is determined by local assessors to be the total taxable value of land and additions on the property. | Land | Improvement |
|---|---|---|---|---|
| 2024 | $2,609 | $111,650 | $40,201 | $71,449 |
| 2023 | $2,466 | $103,272 | $40,201 | $63,071 |
| 2022 | $2,416 | $101,490 | $40,201 | $61,289 |
| 2021 | $2,687 | $90,621 | $40,201 | $50,420 |
| 2020 | $2,228 | $90,621 | $40,201 | $50,420 |
| 2019 | $2,208 | $76,835 | $26,415 | $50,420 |
| 2018 | $2,446 | $81,885 | $24,250 | $57,635 |
| 2017 | $2,518 | $81,885 | $24,250 | $57,635 |
| 2016 | $2,453 | $81,885 | $24,250 | $57,635 |
| 2015 | -- | $81,886 | $24,250 | $57,635 |
| 2014 | -- | $82,312 | $24,250 | $58,061 |
| 2013 | -- | $68,286 | $12,064 | $56,221 |
Source: Public Records
Map
Nearby Homes
- 000 Lakeshore Way
- 696 Cork Ferry Rd
- 276 Lakeshore Way
- 616 Cork Ferry Rd
- 738 Cork Ferry Rd
- 484 Lakeshore Way
- 119 Wolfs Thick Rd
- 629 Cork Ferry Rd
- 199 Hurt Dr
- 120 Cove Rd
- 620 Lakeshore Dr
- 0 Swift Creek Rd Unit 138425
- 118 Swift Creek Rd
- 0 Arabi Warwick Rd
- 144 Bryant Rd
- 102 Perch Dr
- 198 Swift Creek Rd
- 228 Cedar Point Cir
- 000 Bream Rd
- 480 Spring Creek Rd
- 2112 Lakeshore Ct
- 370 Lakeshore Way
- 390 Lakeshore Way
- 2155 Lakeshore Ct
- 2151 Lakeshore Ct
- 2147 Lakeshore Ct
- 362 Lakeshore Way
- 2143 Lakeshore Ct
- 2159 Lakeshore Ct
- 381 Lakeshore Way
- 356 Lakeshore Way
- 2139 Lakeshore Ct
- 2166 Lakeshore Ct
- 396 Lakeshore Way
- 2135 Lakeshore Ct
- 2127 Lakeshore Ct
- 2131 Lakeshore Ct
- 343 Lakeshore Way
- 2123 Lakeshore Ct
- 346 Lakeshore Way