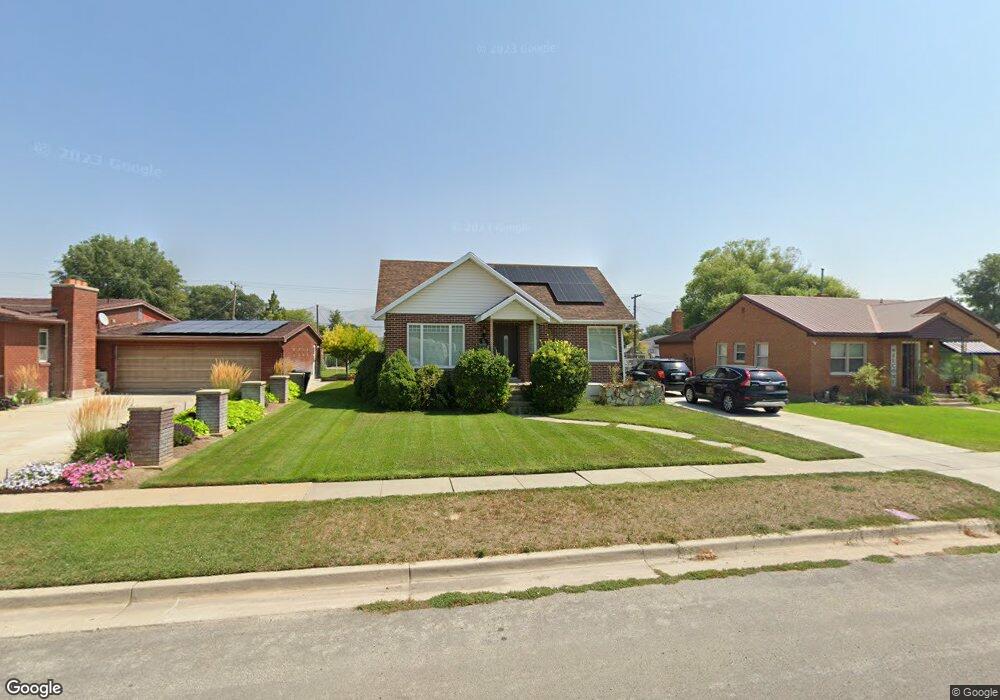
378 N 100 W Tremonton, UT 84337
Estimated Value: $346,000 - $390,000
--
Bed
--
Bath
1,299
Sq Ft
$280/Sq Ft
Est. Value
About This Home
This home is located at 378 N 100 W, Tremonton, UT 84337 and is currently estimated at $363,275, approximately $279 per square foot. 378 N 100 W is a home located in Box Elder County with nearby schools including North Park School, Alice C. Harris Intermediate School, and Bear River Middle School.
Ownership History
Date
Name
Owned For
Owner Type
Purchase Details
Closed on
Oct 24, 2018
Sold by
Ballard Guy Ray and The Denzil G Ballard Family Tr
Bought by
Dasto David M and Dasto Valeria
Current Estimated Value
Home Financials for this Owner
Home Financials are based on the most recent Mortgage that was taken out on this home.
Original Mortgage
$239,393
Outstanding Balance
$209,209
Interest Rate
4.6%
Mortgage Type
New Conventional
Estimated Equity
$154,066
Purchase Details
Closed on
Jul 1, 2009
Sold by
Ballard Beth H and Ballard Guy Ray
Bought by
Ballard Beth H and Ballard Guy Ray
Create a Home Valuation Report for This Property
The Home Valuation Report is an in-depth analysis detailing your home's value as well as a comparison with similar homes in the area
Home Values in the Area
Average Home Value in this Area
Purchase History
| Date | Buyer | Sale Price | Title Company |
|---|---|---|---|
| Dasto David M | -- | Stewart Title Insurance Agen | |
| Ballard Beth H | -- | -- | |
| Ballard Beth H | -- | -- |
Source: Public Records
Mortgage History
| Date | Status | Borrower | Loan Amount |
|---|---|---|---|
| Open | Dasto David M | $239,393 |
Source: Public Records
Tax History Compared to Growth
Tax History
| Year | Tax Paid | Tax Assessment Tax Assessment Total Assessment is a certain percentage of the fair market value that is determined by local assessors to be the total taxable value of land and additions on the property. | Land | Improvement |
|---|---|---|---|---|
| 2025 | $2,001 | $343,336 | $105,000 | $238,336 |
| 2024 | $2,001 | $339,380 | $105,000 | $234,380 |
| 2023 | $2,109 | $351,229 | $100,000 | $251,229 |
| 2022 | $1,867 | $322,257 | $30,000 | $292,257 |
| 2021 | $1,769 | $216,044 | $30,000 | $186,044 |
| 2020 | $1,429 | $216,044 | $30,000 | $186,044 |
| 2019 | $1,326 | $107,053 | $16,500 | $90,553 |
| 2018 | $1,248 | $93,636 | $13,750 | $79,886 |
| 2017 | $1,310 | $145,248 | $0 | $145,248 |
| 2016 | $686 | $47,895 | $13,750 | $34,145 |
| 2015 | $809 | $57,410 | $13,750 | $43,660 |
| 2014 | $809 | $55,331 | $13,750 | $41,581 |
| 2013 | -- | $55,331 | $13,338 | $41,993 |
Source: Public Records
Map
Nearby Homes