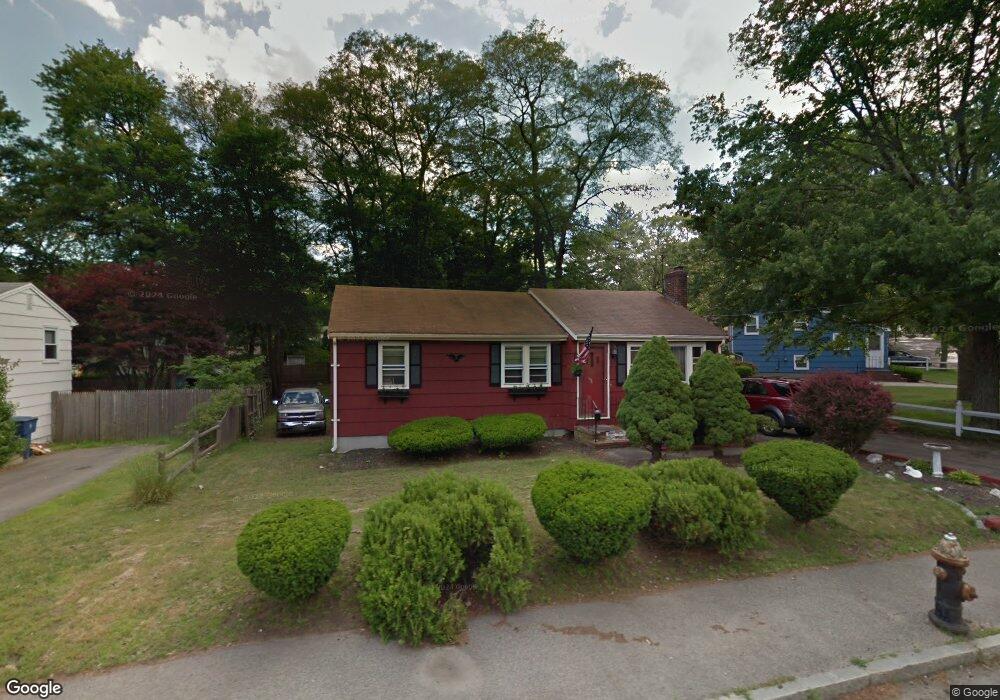
378 N Quincy St Brockton, MA 02302
Montello NeighborhoodEstimated Value: $428,000 - $475,000
3
Beds
1
Bath
992
Sq Ft
$461/Sq Ft
Est. Value
About This Home
This home is located at 378 N Quincy St, Brockton, MA 02302 and is currently estimated at $457,643, approximately $461 per square foot. 378 N Quincy St is a home located in Plymouth County with nearby schools including Brookfield Elementary School, Downey Elementary School, and Ashfield Middle School.
Ownership History
Date
Name
Owned For
Owner Type
Purchase Details
Closed on
Apr 17, 2020
Sold by
Nelson Steven F
Bought by
Nelson Steven F and Nelson Matthew C
Current Estimated Value
Purchase Details
Closed on
Apr 21, 1995
Sold by
Carr Robert G and Carr Nancy J
Bought by
Nelson Steven F and Nelson Donna P
Create a Home Valuation Report for This Property
The Home Valuation Report is an in-depth analysis detailing your home's value as well as a comparison with similar homes in the area
Home Values in the Area
Average Home Value in this Area
Purchase History
| Date | Buyer | Sale Price | Title Company |
|---|---|---|---|
| Nelson Steven F | -- | None Available | |
| Nelson Steven F | $93,000 | -- |
Source: Public Records
Mortgage History
| Date | Status | Borrower | Loan Amount |
|---|---|---|---|
| Previous Owner | Nelson Steven F | $10,000 | |
| Previous Owner | Nelson Steven F | $202,000 |
Source: Public Records
Tax History Compared to Growth
Tax History
| Year | Tax Paid | Tax Assessment Tax Assessment Total Assessment is a certain percentage of the fair market value that is determined by local assessors to be the total taxable value of land and additions on the property. | Land | Improvement |
|---|---|---|---|---|
| 2025 | $4,718 | $389,600 | $144,800 | $244,800 |
| 2024 | $4,691 | $390,300 | $144,800 | $245,500 |
| 2023 | $4,651 | $358,300 | $109,700 | $248,600 |
| 2022 | $4,243 | $303,700 | $99,700 | $204,000 |
| 2021 | $4,089 | $282,000 | $94,200 | $187,800 |
| 2020 | $3,834 | $253,100 | $90,300 | $162,800 |
| 2019 | $3,695 | $237,800 | $84,500 | $153,300 |
| 2018 | $3,432 | $213,700 | $84,500 | $129,200 |
| 2017 | $3,315 | $205,900 | $84,500 | $121,400 |
| 2016 | $3,158 | $181,900 | $80,600 | $101,300 |
| 2015 | $2,920 | $160,900 | $80,600 | $80,300 |
| 2014 | $3,055 | $168,500 | $80,600 | $87,900 |
Source: Public Records
Map
Nearby Homes