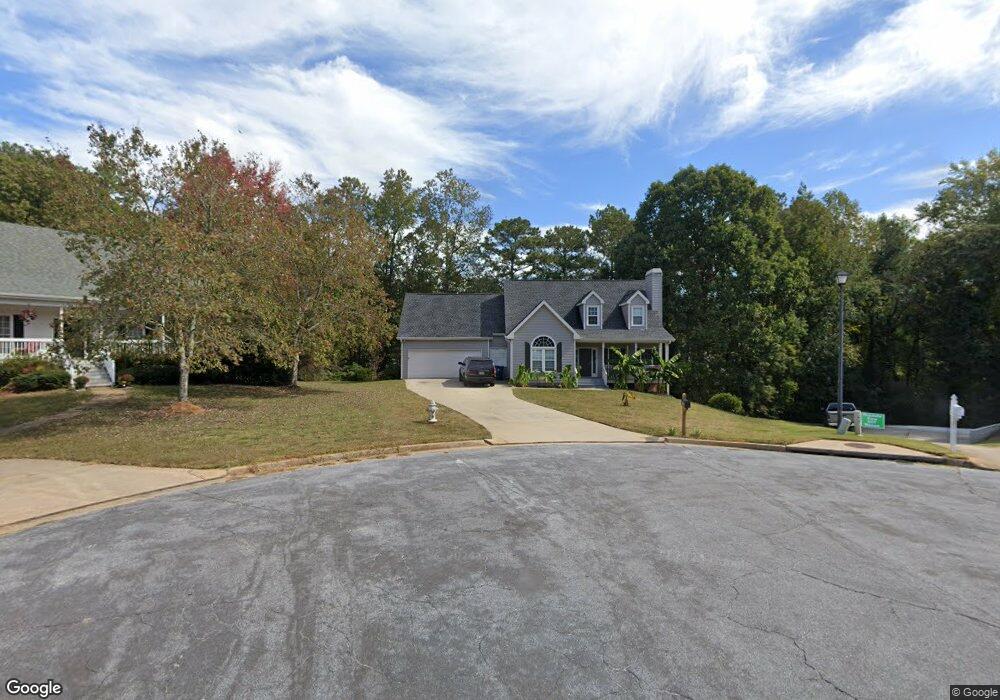
378 Nantucket Way Unit 2 Conyers, GA 30013
Estimated Value: $314,845 - $361,000
4
Beds
3
Baths
2,370
Sq Ft
$143/Sq Ft
Est. Value
About This Home
This home is located at 378 Nantucket Way Unit 2, Conyers, GA 30013 and is currently estimated at $339,461, approximately $143 per square foot. 378 Nantucket Way Unit 2 is a home located in Rockdale County with nearby schools including Honey Creek Elementary School, Memorial Middle School, and Salem High School.
Ownership History
Date
Name
Owned For
Owner Type
Purchase Details
Closed on
Oct 28, 2021
Sold by
Progress Atlanta Llc
Bought by
Progress Residential Borrower 18 Llc
Current Estimated Value
Purchase Details
Closed on
Jun 28, 2021
Sold by
Roebuck Cheryl
Bought by
Progress Atlanta Llc
Purchase Details
Closed on
Aug 29, 2000
Sold by
Madden Julie A and Madden Thomas P
Bought by
Roebuck Cheryl E
Home Financials for this Owner
Home Financials are based on the most recent Mortgage that was taken out on this home.
Original Mortgage
$138,000
Interest Rate
8.24%
Mortgage Type
New Conventional
Purchase Details
Closed on
Jun 12, 1998
Sold by
Jim Florence & Co
Bought by
Madden Julie A and Madden Thomas P
Home Financials for this Owner
Home Financials are based on the most recent Mortgage that was taken out on this home.
Original Mortgage
$122,320
Interest Rate
7.21%
Mortgage Type
New Conventional
Create a Home Valuation Report for This Property
The Home Valuation Report is an in-depth analysis detailing your home's value as well as a comparison with similar homes in the area
Home Values in the Area
Average Home Value in this Area
Purchase History
| Date | Buyer | Sale Price | Title Company |
|---|---|---|---|
| Progress Residential Borrower 18 Llc | -- | -- | |
| Progress Atlanta Llc | $260,000 | -- | |
| Roebuck Cheryl E | $172,500 | -- | |
| Madden Julie A | $152,900 | -- |
Source: Public Records
Mortgage History
| Date | Status | Borrower | Loan Amount |
|---|---|---|---|
| Previous Owner | Roebuck Cheryl E | $138,000 | |
| Previous Owner | Madden Julie A | $122,320 |
Source: Public Records
Tax History Compared to Growth
Tax History
| Year | Tax Paid | Tax Assessment Tax Assessment Total Assessment is a certain percentage of the fair market value that is determined by local assessors to be the total taxable value of land and additions on the property. | Land | Improvement |
|---|---|---|---|---|
| 2024 | $5,536 | $139,320 | $27,160 | $112,160 |
| 2023 | $6,026 | $148,160 | $27,160 | $121,000 |
| 2022 | $4,274 | $124,640 | $24,920 | $99,720 |
| 2021 | $3,752 | $91,800 | $15,600 | $76,200 |
| 2020 | $3,944 | $91,800 | $15,600 | $76,200 |
| 2019 | $3,110 | $68,560 | $8,400 | $60,160 |
| 2018 | $3,123 | $68,560 | $8,400 | $60,160 |
| 2017 | $2,945 | $64,000 | $8,400 | $55,600 |
| 2016 | $1,451 | $64,000 | $8,400 | $55,600 |
| 2015 | $1,366 | $60,960 | $8,400 | $52,560 |
| 2014 | $1,224 | $60,960 | $8,400 | $52,560 |
| 2013 | -- | $63,636 | $10,800 | $52,836 |
Source: Public Records
Map
Nearby Homes
- 1613 Brolington Ct
- 1260 Sweet Shrub Ln SE
- 2791 Wellington Way SE Unit 1
- 2754 Harvest Dr SE
- 1115 Fountain Crest Dr
- 1388 Fall River Dr
- 2684 Harvest Dr SE
- 2052 Evergreen Dr SE
- 2561 Old Salem Cir SE
- 3095 Brombley Dr SE
- 917 Curry Cir SE
- 1135 Vineyard Dr SE
- 1180 Azalea Cir SE
- 2585 Westchester Way SE
- 2474 Harvest Dr SE
- 3111 Green Gate Way SE
- 1813 Holmsey Cir
- 1920 Logan Ln
- 378 Nantucket Way SE
- 1220 Mariners Way SE
- 375 Nantucket Way
- 374 Nantucket Way
- 1210 Mariners Way SE Unit 1
- 370 Nantucket Way Unit 2
- 371 Nantucket Way Unit 2
- 1230 Mariners Way SE
- 1280 Kay Terrace SE Unit 1
- 366 Nantucket Way SE
- 366 Nantucket Way
- 367 Nantucket Way
- 1200 Mariners Way SE
- 1260 Kay Terrace SE Unit 1
- 1240 Kay Terrace SE
- 1230 Kay Terrace SE Unit 1
- 1250 Kay Terrace SE
- 363 Nantucket Way
- 363 Nantucket Way Unit 2
- 0 Mariner's Way SE Unit 7533647