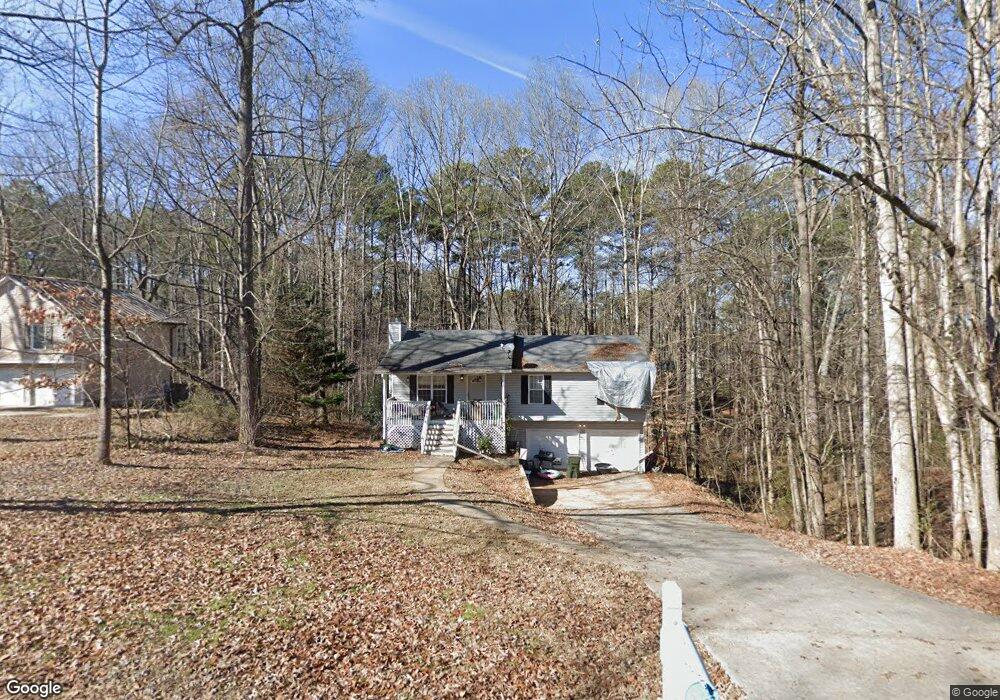
378 Peach Crossing Dr Unit 39 Dallas, GA 30132
Cedarcrest NeighborhoodEstimated Value: $277,000 - $315,000
3
Beds
2
Baths
1,144
Sq Ft
$259/Sq Ft
Est. Value
About This Home
This home is located at 378 Peach Crossing Dr Unit 39, Dallas, GA 30132 and is currently estimated at $296,543, approximately $259 per square foot. 378 Peach Crossing Dr Unit 39 is a home located in Paulding County with nearby schools including W.C. Abney Elementary School, Lena Mae Moses Middle School, and North Paulding High School.
Ownership History
Date
Name
Owned For
Owner Type
Purchase Details
Closed on
Apr 7, 2017
Sold by
Dixon Bradley
Bought by
Milbourne Chelsea and Milbourne Sean
Current Estimated Value
Home Financials for this Owner
Home Financials are based on the most recent Mortgage that was taken out on this home.
Original Mortgage
$122,647
Outstanding Balance
$102,860
Interest Rate
4.5%
Mortgage Type
FHA
Estimated Equity
$193,683
Purchase Details
Closed on
Dec 5, 2013
Sold by
Secretary Of Housing And U
Bought by
Dixon Bradley
Home Financials for this Owner
Home Financials are based on the most recent Mortgage that was taken out on this home.
Original Mortgage
$80,670
Interest Rate
4.12%
Mortgage Type
FHA
Purchase Details
Closed on
Aug 6, 2013
Sold by
Suntrust Mtg Inc
Bought by
Dept Of Housing And Urban Deve
Purchase Details
Closed on
Apr 18, 2008
Sold by
Fuller Michael G
Bought by
Ingram Douglas S and Ingram Jessica
Home Financials for this Owner
Home Financials are based on the most recent Mortgage that was taken out on this home.
Original Mortgage
$105,248
Interest Rate
6.03%
Mortgage Type
FHA
Create a Home Valuation Report for This Property
The Home Valuation Report is an in-depth analysis detailing your home's value as well as a comparison with similar homes in the area
Home Values in the Area
Average Home Value in this Area
Purchase History
| Date | Buyer | Sale Price | Title Company |
|---|---|---|---|
| Milbourne Chelsea | $128,000 | -- | |
| Dixon Bradley | $85,000 | -- | |
| Dept Of Housing And Urban Deve | -- | -- | |
| Suntrust Mtg Inc | -- | -- | |
| Ingram Douglas S | $106,900 | -- |
Source: Public Records
Mortgage History
| Date | Status | Borrower | Loan Amount |
|---|---|---|---|
| Open | Milbourne Chelsea | $122,647 | |
| Previous Owner | Dixon Bradley | $80,670 | |
| Previous Owner | Ingram Douglas S | $105,248 |
Source: Public Records
Tax History Compared to Growth
Tax History
| Year | Tax Paid | Tax Assessment Tax Assessment Total Assessment is a certain percentage of the fair market value that is determined by local assessors to be the total taxable value of land and additions on the property. | Land | Improvement |
|---|---|---|---|---|
| 2024 | $2,984 | $119,952 | $12,000 | $107,952 |
| 2023 | $2,805 | $107,584 | $12,000 | $95,584 |
| 2022 | $2,284 | $87,600 | $12,000 | $75,600 |
| 2021 | $2,036 | $70,064 | $10,000 | $60,064 |
| 2020 | $1,933 | $65,096 | $10,000 | $55,096 |
| 2019 | $1,758 | $58,336 | $10,000 | $48,336 |
| 2018 | $1,475 | $48,960 | $8,000 | $40,960 |
| 2017 | $1,375 | $46,880 | $8,000 | $38,880 |
| 2016 | $1,278 | $44,120 | $8,000 | $36,120 |
| 2015 | $1,244 | $42,280 | $8,000 | $34,280 |
| 2014 | $1,026 | $38,560 | $8,000 | $30,560 |
| 2013 | -- | $31,040 | $8,000 | $23,040 |
Source: Public Records
Map
Nearby Homes
- 274 Peach Crossing Dr
- 232 Northridge Dr
- 135 Lantana Crossing
- 244 Freestone Ln
- 160 Northridge Dr
- 76 Lantana Crossing
- 25 Creekstone Dr
- 116 Four Seasons Blvd
- 137 Cranberry Blossom Way
- 75 S Cornucopia Bend
- 173 Barberry Ln
- 35 Indigo Ct
- 140 Crepe Myrtle Way
- 0 Dallas Acworth Hwy Unit 10624105
- 0 Dallas Acworth Hwy Unit 7665160
- 45 Homestead Dr
- 312 Deer Run Dr
- 402 Homestead Dr
- 378 Peach Crossing Dr
- 400 Peach Crossing Dr
- 356 Peach Crossing Dr
- 191 Peach Crossing Dr Unit Lot 6a
- 185 Peach Crossing Dr Unit Lot 6
- 430 Peach Crossing Dr
- 395 Peach Crossing Dr
- 299 Peach Crossing Dr
- 190 Nectar Place
- 200 Nectar Place
- 334 Peach Crossing Dr
- 330 Peach Crossing Dr
- 100 Nectar Place
- 100 Nectar Place
- 433 Peach Crossing Dr
- 340 Peach Crossing Dr
- 199 Nectar Place
- 281 Peach Crossing Dr
- 112 Nectar Place Unit 2
- 45 Freestone Ln