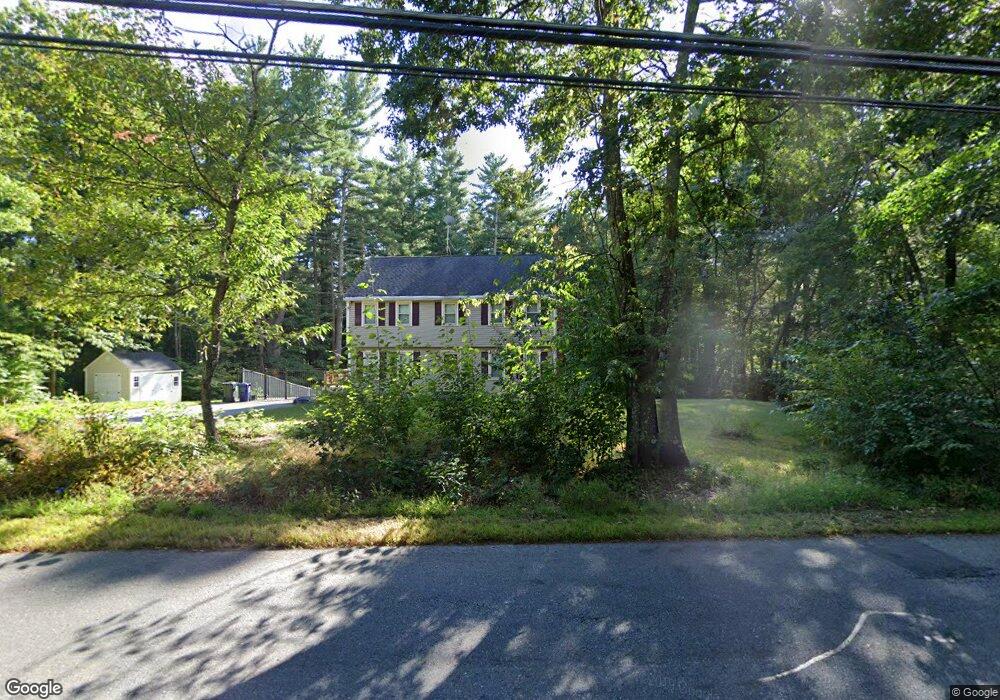
378 Pelham Rd Dracut, MA 01826
Estimated Value: $626,125 - $673,000
4
Beds
2
Baths
1,800
Sq Ft
$362/Sq Ft
Est. Value
About This Home
This home is located at 378 Pelham Rd, Dracut, MA 01826 and is currently estimated at $652,031, approximately $362 per square foot. 378 Pelham Rd is a home located in Middlesex County with nearby schools including Joseph A. Campbell Elementary School, Richardson Middle School, and Dracut Senior High School.
Ownership History
Date
Name
Owned For
Owner Type
Purchase Details
Closed on
Jul 30, 2009
Sold by
Ippolito Dominic J and Ippolito Nancy L
Bought by
Tusinski Carolyn E
Current Estimated Value
Home Financials for this Owner
Home Financials are based on the most recent Mortgage that was taken out on this home.
Original Mortgage
$248,000
Outstanding Balance
$163,502
Interest Rate
5.43%
Mortgage Type
Purchase Money Mortgage
Estimated Equity
$488,529
Purchase Details
Closed on
Jan 20, 1989
Sold by
Campaiola Carmine R
Bought by
Ippolito Dominic
Home Financials for this Owner
Home Financials are based on the most recent Mortgage that was taken out on this home.
Original Mortgage
$166,200
Interest Rate
10.38%
Mortgage Type
Purchase Money Mortgage
Create a Home Valuation Report for This Property
The Home Valuation Report is an in-depth analysis detailing your home's value as well as a comparison with similar homes in the area
Home Values in the Area
Average Home Value in this Area
Purchase History
| Date | Buyer | Sale Price | Title Company |
|---|---|---|---|
| Tusinski Carolyn E | $310,000 | -- | |
| Ippolito Dominic | $185,200 | -- |
Source: Public Records
Mortgage History
| Date | Status | Borrower | Loan Amount |
|---|---|---|---|
| Open | Tusinski Carolyn E | $248,000 | |
| Previous Owner | Ippolito Dominic | $166,200 |
Source: Public Records
Tax History Compared to Growth
Tax History
| Year | Tax Paid | Tax Assessment Tax Assessment Total Assessment is a certain percentage of the fair market value that is determined by local assessors to be the total taxable value of land and additions on the property. | Land | Improvement |
|---|---|---|---|---|
| 2025 | $5,739 | $567,100 | $234,000 | $333,100 |
| 2024 | $5,506 | $526,900 | $223,000 | $303,900 |
| 2023 | $5,444 | $470,100 | $194,000 | $276,100 |
| 2022 | $5,303 | $431,500 | $176,600 | $254,900 |
| 2021 | $5,083 | $390,700 | $160,500 | $230,200 |
| 2020 | $4,926 | $369,000 | $155,700 | $213,300 |
| 2019 | $4,715 | $342,900 | $148,300 | $194,600 |
| 2018 | $4,792 | $338,900 | $148,300 | $190,600 |
| 2017 | $4,763 | $338,900 | $148,300 | $190,600 |
| 2016 | $4,636 | $312,400 | $142,600 | $169,800 |
| 2015 | $4,482 | $300,200 | $142,600 | $157,600 |
| 2014 | $4,199 | $289,800 | $142,600 | $147,200 |
Source: Public Records
Map
Nearby Homes