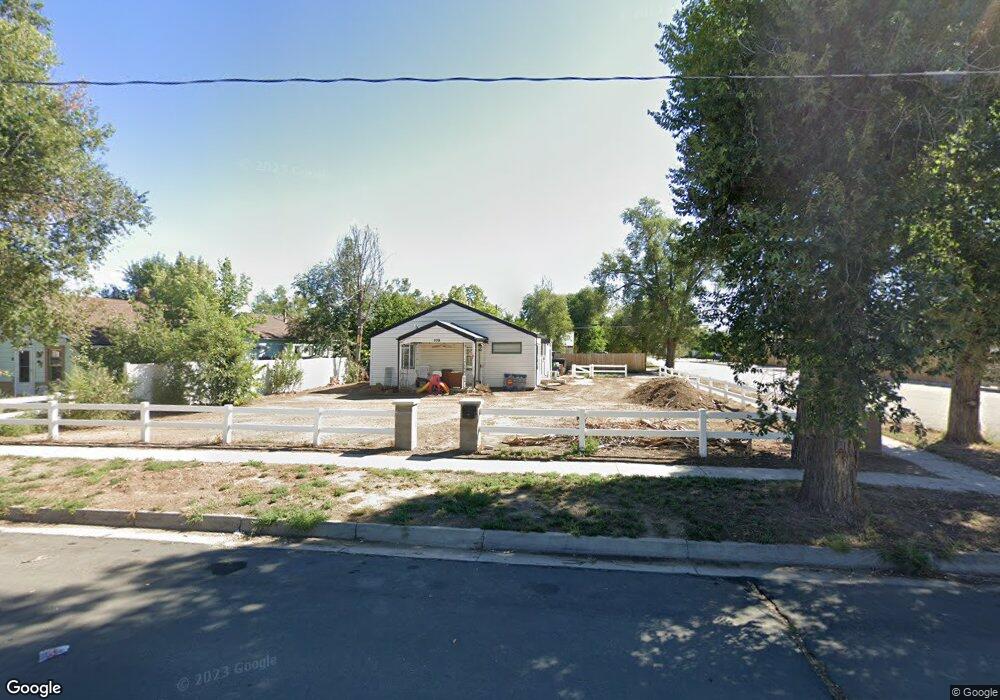
378 S 2nd Ave Brighton, CO 80601
Estimated Value: $390,743 - $405,000
3
Beds
1
Bath
1,080
Sq Ft
$368/Sq Ft
Est. Value
About This Home
This home is located at 378 S 2nd Ave, Brighton, CO 80601 and is currently estimated at $397,186, approximately $367 per square foot. 378 S 2nd Ave is a home located in Adams County with nearby schools including South Elementary School, Vikan Middle School, and Brighton High School.
Ownership History
Date
Name
Owned For
Owner Type
Purchase Details
Closed on
Aug 10, 2020
Sold by
Gonzales Felix A
Bought by
Johnson Joshua and Johnson Brianne
Current Estimated Value
Home Financials for this Owner
Home Financials are based on the most recent Mortgage that was taken out on this home.
Original Mortgage
$294,566
Interest Rate
2.8%
Mortgage Type
FHA
Purchase Details
Closed on
Dec 8, 2014
Sold by
Amos Lyle V
Bought by
Gonzales Felix A
Purchase Details
Closed on
Sep 14, 1999
Sold by
Amos Betty C
Bought by
Amos Lyle V
Create a Home Valuation Report for This Property
The Home Valuation Report is an in-depth analysis detailing your home's value as well as a comparison with similar homes in the area
Home Values in the Area
Average Home Value in this Area
Purchase History
| Date | Buyer | Sale Price | Title Company |
|---|---|---|---|
| Johnson Joshua | $300,000 | First American Title Ins Co | |
| Gonzales Felix A | $205,000 | Land Title Guarantee Company | |
| Amos Lyle V | -- | -- |
Source: Public Records
Mortgage History
| Date | Status | Borrower | Loan Amount |
|---|---|---|---|
| Open | Johnson Joshua | $11,782 | |
| Previous Owner | Johnson Joshua | $294,566 |
Source: Public Records
Tax History Compared to Growth
Tax History
| Year | Tax Paid | Tax Assessment Tax Assessment Total Assessment is a certain percentage of the fair market value that is determined by local assessors to be the total taxable value of land and additions on the property. | Land | Improvement |
|---|---|---|---|---|
| 2024 | $2,784 | $26,500 | $5,310 | $21,190 |
| 2023 | $2,770 | $28,880 | $5,410 | $23,470 |
| 2022 | $2,287 | $20,820 | $4,930 | $15,890 |
| 2021 | $2,143 | $20,820 | $4,930 | $15,890 |
| 2020 | $2,200 | $22,280 | $4,860 | $17,420 |
| 2019 | $2,202 | $22,280 | $4,860 | $17,420 |
| 2018 | $1,670 | $16,890 | $4,750 | $12,140 |
| 2017 | $1,668 | $16,890 | $4,750 | $12,140 |
| 2016 | $945 | $9,540 | $2,390 | $7,150 |
| 2015 | $943 | $9,540 | $2,390 | $7,150 |
| 2014 | $1,062 | $10,900 | $1,910 | $8,990 |
Source: Public Records
Map
Nearby Homes