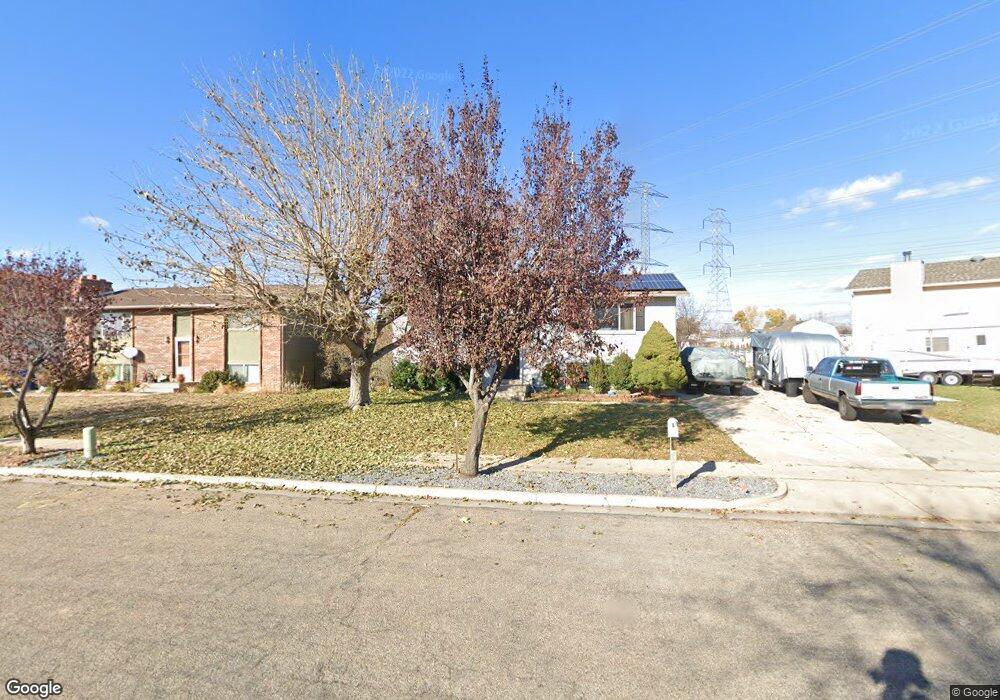
378 W 2225 S Clearfield, UT 84015
Estimated Value: $397,000 - $418,937
4
Beds
2
Baths
980
Sq Ft
$414/Sq Ft
Est. Value
About This Home
This home is located at 378 W 2225 S, Clearfield, UT 84015 and is currently estimated at $405,234, approximately $413 per square foot. 378 W 2225 S is a home located in Davis County with nearby schools including Antelope Elementary School, North Davis Junior High School, and Clearfield High School.
Ownership History
Date
Name
Owned For
Owner Type
Purchase Details
Closed on
May 13, 2019
Sold by
Vasquez Koral A
Bought by
The Vandaveer Vasquez Family Trust
Current Estimated Value
Purchase Details
Closed on
Jun 17, 2005
Sold by
Vasquez Koral A
Bought by
Vasquez Koral A
Home Financials for this Owner
Home Financials are based on the most recent Mortgage that was taken out on this home.
Original Mortgage
$116,633
Interest Rate
5.72%
Mortgage Type
Purchase Money Mortgage
Purchase Details
Closed on
Mar 20, 2002
Sold by
Vasquez Damon and Vasquez Koral A
Bought by
Vasquez Koral A
Home Financials for this Owner
Home Financials are based on the most recent Mortgage that was taken out on this home.
Original Mortgage
$89,600
Interest Rate
6.84%
Create a Home Valuation Report for This Property
The Home Valuation Report is an in-depth analysis detailing your home's value as well as a comparison with similar homes in the area
Home Values in the Area
Average Home Value in this Area
Purchase History
| Date | Buyer | Sale Price | Title Company |
|---|---|---|---|
| The Vandaveer Vasquez Family Trust | -- | None Available | |
| Vasquez Koral A | -- | Executive Title Ins Agency | |
| Vasquez Koral A | -- | First American Title Co |
Source: Public Records
Mortgage History
| Date | Status | Borrower | Loan Amount |
|---|---|---|---|
| Closed | Vasquez Koral A | $116,633 | |
| Closed | Vasquez Koral A | $89,600 | |
| Closed | Vasquez Koral A | $22,400 |
Source: Public Records
Tax History Compared to Growth
Tax History
| Year | Tax Paid | Tax Assessment Tax Assessment Total Assessment is a certain percentage of the fair market value that is determined by local assessors to be the total taxable value of land and additions on the property. | Land | Improvement |
|---|---|---|---|---|
| 2025 | $2,320 | $207,900 | $61,279 | $146,621 |
| 2024 | $2,254 | $203,500 | $58,587 | $144,913 |
| 2023 | $2,070 | $343,000 | $93,775 | $249,225 |
| 2022 | $2,087 | $187,000 | $53,727 | $133,273 |
| 2021 | $1,810 | $245,000 | $56,998 | $188,002 |
| 2020 | $1,569 | $211,000 | $47,912 | $163,088 |
| 2019 | $1,514 | $201,000 | $50,296 | $150,704 |
| 2018 | $1,361 | $176,000 | $44,643 | $131,357 |
| 2016 | $1,184 | $80,080 | $20,970 | $59,110 |
| 2015 | $1,125 | $72,490 | $20,970 | $51,520 |
| 2014 | $1,047 | $68,414 | $20,970 | $47,444 |
| 2013 | -- | $59,756 | $23,653 | $36,103 |
Source: Public Records
Map
Nearby Homes