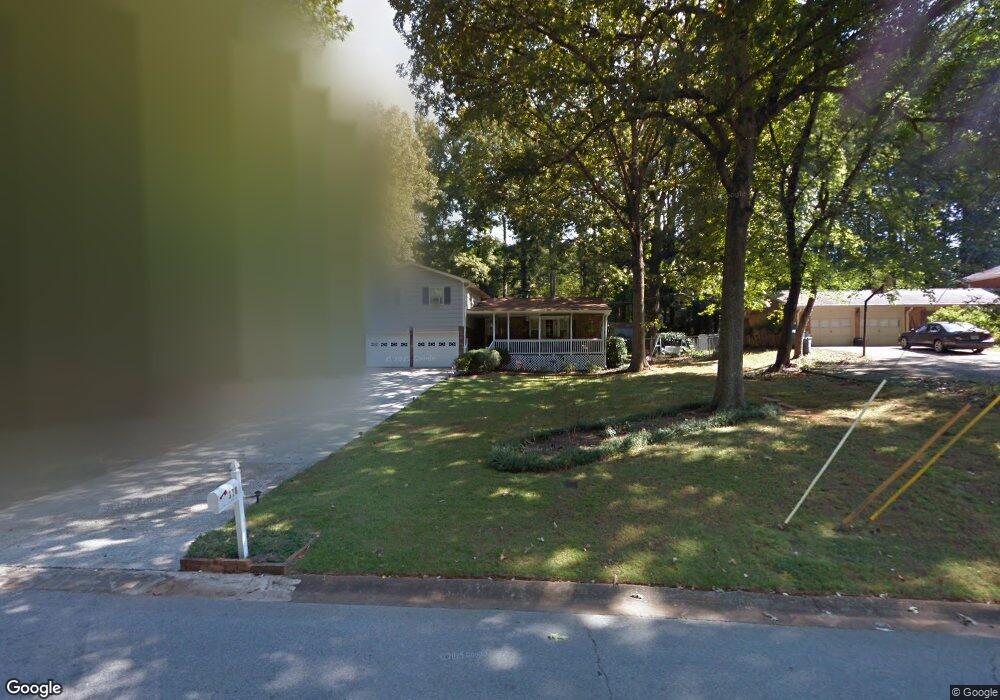
378 W Wind Dr SW Unit 23 Lilburn, GA 30047
Estimated Value: $326,939 - $372,000
3
Beds
3
Baths
1,684
Sq Ft
$208/Sq Ft
Est. Value
About This Home
This home is located at 378 W Wind Dr SW Unit 23, Lilburn, GA 30047 and is currently estimated at $350,485, approximately $208 per square foot. 378 W Wind Dr SW Unit 23 is a home located in Gwinnett County with nearby schools including Arcado Elementary School, Trickum Middle School, and Parkview High School.
Ownership History
Date
Name
Owned For
Owner Type
Purchase Details
Closed on
Jun 19, 2015
Sold by
Waldrop Evelyn L
Bought by
Tam Khi
Current Estimated Value
Home Financials for this Owner
Home Financials are based on the most recent Mortgage that was taken out on this home.
Original Mortgage
$142,450
Outstanding Balance
$110,331
Interest Rate
3.75%
Mortgage Type
FHA
Estimated Equity
$240,154
Purchase Details
Closed on
Mar 15, 2004
Sold by
Foster Evelyn L
Bought by
Waldrop Evelyn L and Waldrop Charles
Home Financials for this Owner
Home Financials are based on the most recent Mortgage that was taken out on this home.
Original Mortgage
$105,500
Interest Rate
5.62%
Mortgage Type
New Conventional
Purchase Details
Closed on
Jan 4, 2001
Sold by
Foster Wesley
Bought by
Foster Evelyn L
Home Financials for this Owner
Home Financials are based on the most recent Mortgage that was taken out on this home.
Original Mortgage
$103,200
Interest Rate
7.53%
Mortgage Type
New Conventional
Create a Home Valuation Report for This Property
The Home Valuation Report is an in-depth analysis detailing your home's value as well as a comparison with similar homes in the area
Home Values in the Area
Average Home Value in this Area
Purchase History
| Date | Buyer | Sale Price | Title Company |
|---|---|---|---|
| Tam Khi | $150,000 | -- | |
| Waldrop Evelyn L | -- | -- | |
| Foster Evelyn L | $30,000 | -- |
Source: Public Records
Mortgage History
| Date | Status | Borrower | Loan Amount |
|---|---|---|---|
| Open | Tam Khi | $142,450 | |
| Previous Owner | Waldrop Evelyn L | $105,500 | |
| Previous Owner | Foster Evelyn L | $103,200 |
Source: Public Records
Tax History Compared to Growth
Tax History
| Year | Tax Paid | Tax Assessment Tax Assessment Total Assessment is a certain percentage of the fair market value that is determined by local assessors to be the total taxable value of land and additions on the property. | Land | Improvement |
|---|---|---|---|---|
| 2024 | $3,398 | $118,480 | $26,120 | $92,360 |
| 2023 | $3,398 | $114,080 | $24,000 | $90,080 |
| 2022 | $2,962 | $99,240 | $24,000 | $75,240 |
| 2021 | $2,483 | $74,680 | $17,200 | $57,480 |
| 2020 | $2,499 | $74,680 | $17,200 | $57,480 |
| 2019 | $2,279 | $67,480 | $14,000 | $53,480 |
| 2018 | $2,165 | $62,320 | $14,000 | $48,320 |
| 2016 | $2,036 | $55,360 | $14,000 | $41,360 |
| 2015 | $1,805 | $51,320 | $14,000 | $37,320 |
| 2014 | $1,648 | $43,840 | $14,000 | $29,840 |
Source: Public Records
Map
Nearby Homes
- 358 W Wind Dr SW
- 5531 Four Winds Dr SW
- 5521 E Wind Dr SW
- 228 Amour Way SW
- 5533 N Wind Dr SW
- 5781 Four Winds Dr SW Unit 1B
- 5265 Sunset Maple Trail Unit 3
- 5221 La Paloma Dr SW Unit 1
- 262 Harmony Grove Rd
- 215 Hauteur Place SW
- 5741 Wolf Laurel Ln SW
- 574 Horseshoe Cir SW
- 90 Cross Creek Dr
- 222 Black Birch Pass
- 483 Rollingwood Dr
- 140 Cross Creek Dr
- 737 Lioness Ct
- 551 Briggs Cir SW
- 378 W Wind Dr SW Unit 4
- 388 W Wind Dr SW
- 368 W Wind Dr SW
- 379 Wayward Wind Dr SW
- 389 Wayward Wind Dr SW
- 398 W Wind Dr SW Unit 3
- 369 Wayward Wind Dr SW
- 377 W Wind Dr SW Unit 350
- 377 W Wind Dr SW
- 377 W Wind Dr SW
- 377 W Wind Dr SW Unit O
- 387 W Wind Dr SW
- 399 Wayward Wind Dr SW
- 358 W West Wind Dr SW
- 358 SW W Wind Dr
- 359 Wayward Wind Dr SW
- 397 W Wind Dr SW Unit 3
- 350 W Wind Dr SW Unit 4
- 0 Wayward Wind Dr SW Unit 3248056
- 0 Wayward Wind Dr SW Unit 8710327