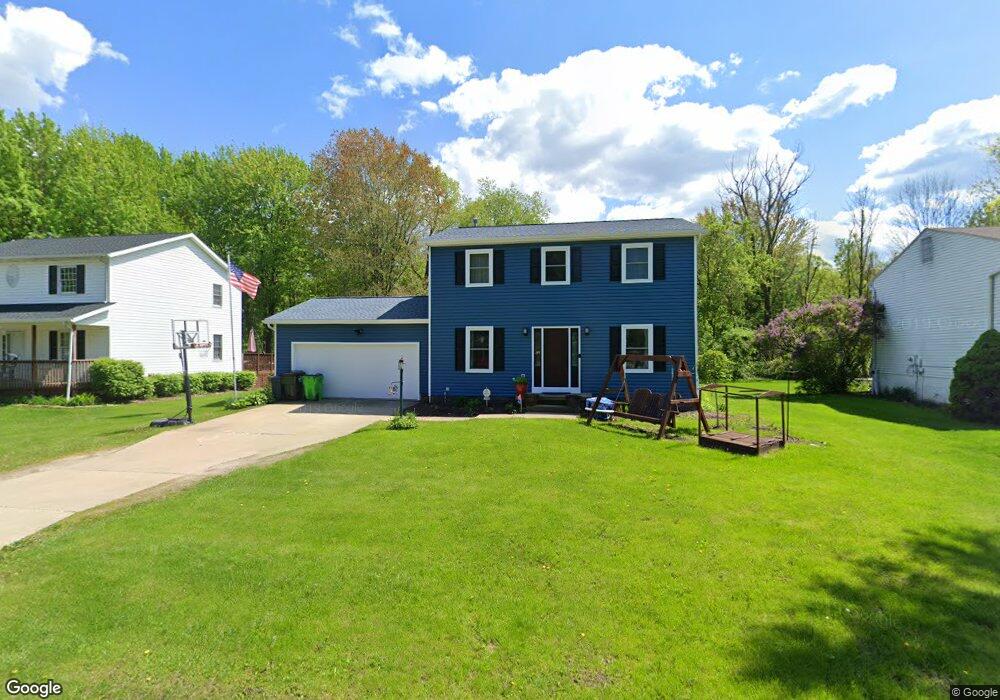
3780 Surfside Cir Aurora, OH 44202
Estimated Value: $346,555 - $373,000
3
Beds
3
Baths
1,736
Sq Ft
$208/Sq Ft
Est. Value
About This Home
This home is located at 3780 Surfside Cir, Aurora, OH 44202 and is currently estimated at $361,889, approximately $208 per square foot. 3780 Surfside Cir is a home located in Summit County with nearby schools including Wilcox Primary School, Samuel Bissell Elementary School, and Dodge Intermediate School.
Ownership History
Date
Name
Owned For
Owner Type
Purchase Details
Closed on
Dec 12, 2007
Sold by
Brewster Charles H and Brewster Candice K
Bought by
Nutter James A and Nutter Linda D
Current Estimated Value
Home Financials for this Owner
Home Financials are based on the most recent Mortgage that was taken out on this home.
Original Mortgage
$164,050
Interest Rate
6.31%
Mortgage Type
Purchase Money Mortgage
Purchase Details
Closed on
Mar 18, 1999
Sold by
Ja Talentino Kimberly H Talentino James Mic
Bought by
Brewster Charles H and Brewster Candice K
Home Financials for this Owner
Home Financials are based on the most recent Mortgage that was taken out on this home.
Original Mortgage
$147,250
Interest Rate
6.8%
Create a Home Valuation Report for This Property
The Home Valuation Report is an in-depth analysis detailing your home's value as well as a comparison with similar homes in the area
Home Values in the Area
Average Home Value in this Area
Purchase History
| Date | Buyer | Sale Price | Title Company |
|---|---|---|---|
| Nutter James A | $193,000 | Attorney | |
| Brewster Charles H | $155,000 | Progressive Land Title Agenc |
Source: Public Records
Mortgage History
| Date | Status | Borrower | Loan Amount |
|---|---|---|---|
| Closed | Nutter James A | $164,050 | |
| Closed | Brewster Charles H | $147,250 |
Source: Public Records
Tax History
| Year | Tax Paid | Tax Assessment Tax Assessment Total Assessment is a certain percentage of the fair market value that is determined by local assessors to be the total taxable value of land and additions on the property. | Land | Improvement |
|---|---|---|---|---|
| 2025 | $5,102 | $100,759 | $14,970 | $85,789 |
| 2024 | $5,102 | $100,759 | $14,970 | $85,789 |
| 2023 | $5,102 | $100,759 | $14,970 | $85,789 |
| 2022 | $4,210 | $74,634 | $11,088 | $63,546 |
| 2021 | $4,229 | $74,634 | $11,088 | $63,546 |
| 2020 | $4,280 | $74,640 | $11,090 | $63,550 |
| 2019 | $4,253 | $69,060 | $11,090 | $57,970 |
| 2018 | $4,175 | $69,060 | $11,090 | $57,970 |
| 2017 | $3,511 | $69,060 | $11,090 | $57,970 |
| 2016 | $3,491 | $61,620 | $11,090 | $50,530 |
| 2015 | $3,511 | $61,620 | $11,090 | $50,530 |
| 2014 | $3,502 | $61,620 | $11,090 | $50,530 |
| 2013 | $3,545 | $62,350 | $14,050 | $48,300 |
Source: Public Records
Map
Nearby Homes
- 3624 Nautilus Trail
- 10137 Tradewinds Cove
- 3660 Ivy Ct
- 3659 Shady Timber Dr
- 10400 Maryland St
- 3784 Firethorn Dr
- 10453 Dogwood Dr
- 10265 Beaver Trail
- 3564 Shady Timber Dr
- 10373 Glenway Dr Unit 202
- 10564 Herrington Dr
- 1060 Bryce Ave
- 1177 Moneta Ave
- 436 Cochran Rd
- 954 Bryce Ave
- 1000 Michigan St
- 1101 Lake Ave
- 1145 W Parkway Blvd
- SL Moneta Ave
- S/L 4 Trentstone Cir
- 3788 Surfside Cir
- 3772 Surfside Cir
- 3764 Surfside Cir
- 3796 Surfside Cir
- 3756 Surfside Cir
- 3804 Surfside Cir
- 3781 Surfside Cir
- 9990 Crows Nest Cove
- 3755 Surfside Cir
- 3812 Surfside Cir
- 10001 Crows Nest Cove
- 3744 Surfside Cir
- 9983 Regatta Trail
- 3807 Surfside Cir
- 3745 Surfside Cir
- 9975 Regatta Trail
- 10000 Crows Nest Cove
- 3820 Surfside Cir
- 10009 Crows Nest Cove
- 9967 Regatta Trail
Your Personal Tour Guide
Ask me questions while you tour the home.