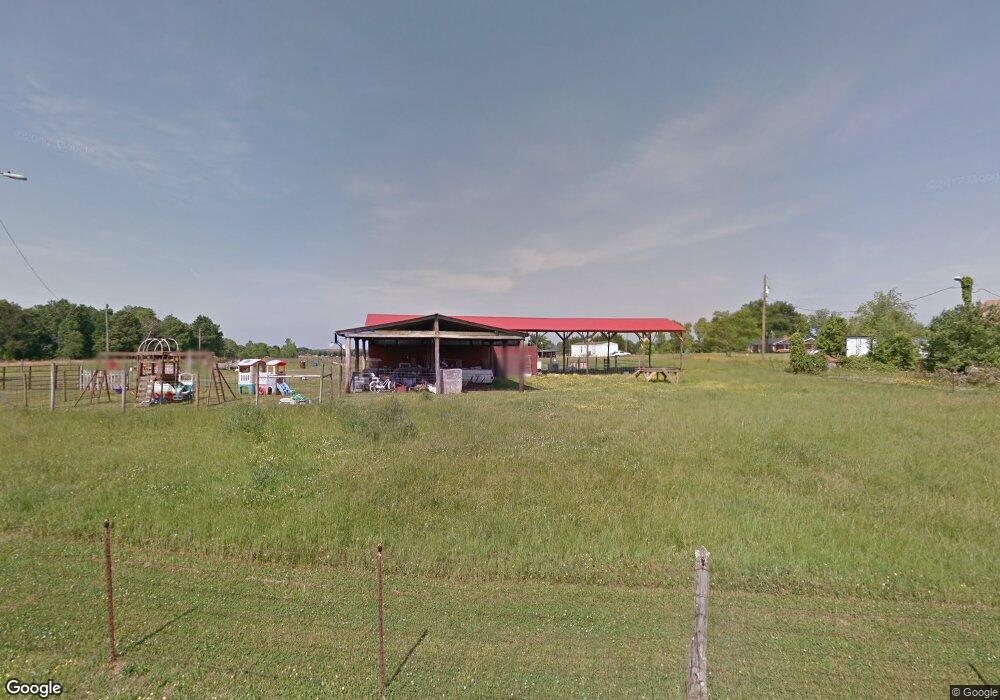
3782 Baxter Implement Rd Cherryville, NC 28021
Estimated Value: $220,000 - $263,000
3
Beds
1
Bath
1,148
Sq Ft
$207/Sq Ft
Est. Value
About This Home
This home is located at 3782 Baxter Implement Rd, Cherryville, NC 28021 and is currently estimated at $237,609, approximately $206 per square foot. 3782 Baxter Implement Rd is a home located in Lincoln County with nearby schools including North Brook Elementary School, West Lincoln Middle, and West Lincoln High School.
Ownership History
Date
Name
Owned For
Owner Type
Purchase Details
Closed on
Jun 21, 2006
Sold by
Federal Home Loan Mortgage Corporation
Bought by
Neal Daniel and Neal Tonya
Current Estimated Value
Home Financials for this Owner
Home Financials are based on the most recent Mortgage that was taken out on this home.
Original Mortgage
$95,676
Outstanding Balance
$56,187
Interest Rate
6.55%
Mortgage Type
New Conventional
Estimated Equity
$181,422
Purchase Details
Closed on
Apr 18, 2006
Sold by
West Kenny R and West Alice M
Bought by
Federal Home Loan Mortgage Corporation
Purchase Details
Closed on
May 15, 1998
Bought by
West Alice M and Kenny Ray West
Purchase Details
Closed on
Feb 23, 1994
Bought by
Johnson Lynn Eric and John Valerie R
Purchase Details
Closed on
Apr 22, 1993
Bought by
Johnson Valerie R
Purchase Details
Closed on
Mar 10, 1992
Bought by
Baxter David
Create a Home Valuation Report for This Property
The Home Valuation Report is an in-depth analysis detailing your home's value as well as a comparison with similar homes in the area
Home Values in the Area
Average Home Value in this Area
Purchase History
| Date | Buyer | Sale Price | Title Company |
|---|---|---|---|
| Neal Daniel | -- | None Available | |
| Federal Home Loan Mortgage Corporation | $101,866 | None Available | |
| West Alice M | $87,500 | -- | |
| Johnson Lynn Eric | $5,000 | -- | |
| Johnson Valerie R | $58,000 | -- | |
| Baxter David | $13,000 | -- |
Source: Public Records
Mortgage History
| Date | Status | Borrower | Loan Amount |
|---|---|---|---|
| Open | Neal Daniel | $95,676 |
Source: Public Records
Tax History
| Year | Tax Paid | Tax Assessment Tax Assessment Total Assessment is a certain percentage of the fair market value that is determined by local assessors to be the total taxable value of land and additions on the property. | Land | Improvement |
|---|---|---|---|---|
| 2025 | $1,157 | $171,225 | $59,203 | $112,022 |
| 2024 | $1,137 | $171,225 | $59,203 | $112,022 |
| 2023 | $1,132 | $171,225 | $59,203 | $112,022 |
| 2022 | $842 | $101,147 | $39,252 | $61,895 |
| 2021 | $842 | $101,147 | $39,252 | $61,895 |
| 2020 | $707 | $101,147 | $39,252 | $61,895 |
| 2019 | $707 | $101,147 | $39,252 | $61,895 |
| 2018 | $714 | $86,181 | $33,696 | $52,485 |
| 2017 | $613 | $86,181 | $33,696 | $52,485 |
| 2016 | $613 | $86,181 | $33,696 | $52,485 |
| 2015 | $686 | $86,181 | $33,696 | $52,485 |
| 2014 | $679 | $90,703 | $37,724 | $52,979 |
Source: Public Records
Map
Nearby Homes
- 2491 Highway 274
- 00 Star Ln Unit 1
- 6316 Hill Gates Trail
- 00 Hill Gates Trail Unit 32
- 00 Hill Gates Trail Unit 31
- 00 Hill Gates Trail Unit 37
- 00 Hill Gates Trail Unit 38
- 345A Black Rock School Rd
- 6203 Flay Rd
- LOT Black Rock School Rd Unit 1
- 114 Black Rock School Rd
- 5790 Summer Ln
- 5199 Helms End of Trail
- 1470 Requa Rd
- 110 Johnson Rd
- 3933-1 Fallston-Waco Rd
- 2483 Lee Bess Rd
- 5043 Poplin Valley
- 5041 Poplin Valley
- 5036 Poplin Valley
- 6573 Highway 182
- 6613 Highway 182
- 3840 Baxter Implement Rd
- 6562 Highway 182
- 6606 Highway 182
- 6606 N Carolina 182
- 3856 Baxter Implement Rd
- 3868 Baxter Implement Rd
- 6622 Highway 182
- 3908 Baxter Implement Rd
- 6736 Highway 182
- 3964 Baxter Implement Rd
- 6764 Highway 182
- 6406 Highway 182
- 1408 Baxter Rd
- 1409 Baxter Rd
- 3973 Sorrells Baxter Rd
- 6318 Highway 182
- 548 Fisher Rd
- 548 Fisher Rd
Your Personal Tour Guide
Ask me questions while you tour the home.