Estimated Value: $508,000 - $619,000
4
Beds
3
Baths
1,678
Sq Ft
$330/Sq Ft
Est. Value
About This Home
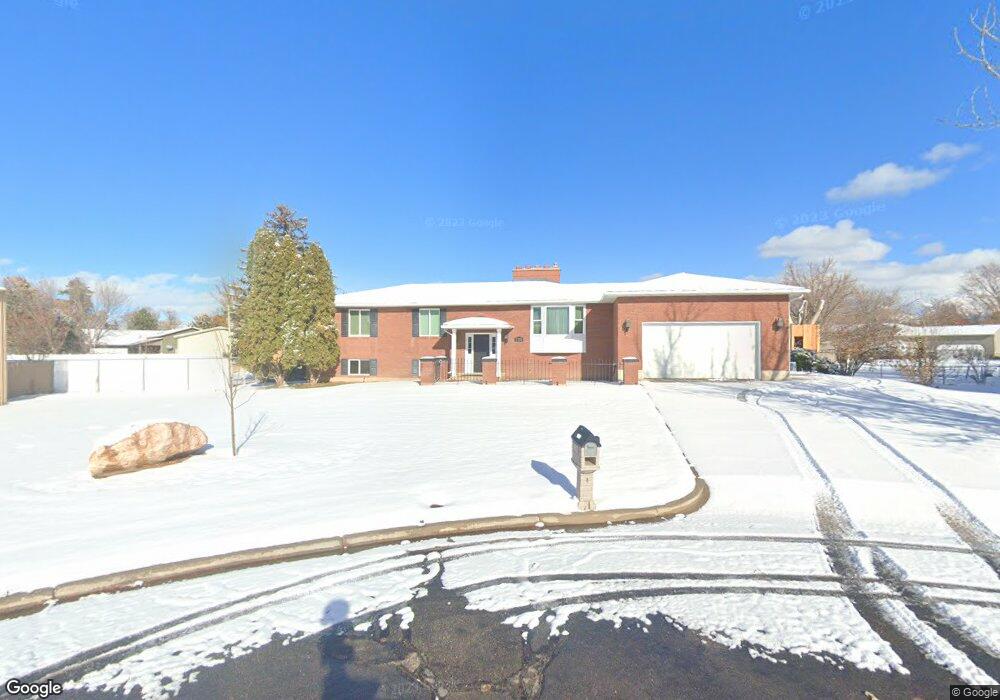
This home is located at 3782 W 5900 S, Roy, UT 84067 and is currently estimated at $553,274, approximately $329 per square foot. 3782 W 5900 S is a home located in Weber County with nearby schools including Midland School, Roy Junior High School, and Roy High School.
Ownership History
Date
Name
Owned For
Owner Type
Purchase Details
Closed on
Dec 10, 2024
Sold by
Anderson Teri Lynn
Bought by
Anderson Jeffrey
Current Estimated Value
Purchase Details
Closed on
Jun 27, 2022
Sold by
Joan Anderson
Bought by
Anderson Jeffrey and Anderson Teri Lynn
Purchase Details
Closed on
May 16, 2008
Sold by
Anderson James R
Bought by
Anderson Joan
Create a Home Valuation Report for This Property
The Home Valuation Report is an in-depth analysis detailing your home's value as well as a comparison with similar homes in the area
Home Values in the Area
Average Home Value in this Area
Purchase History
| Date | Buyer | Sale Price | Title Company |
|---|---|---|---|
| Anderson Jeffrey | -- | None Listed On Document | |
| Anderson Jeffrey | -- | None Listed On Document | |
| Anderson Joan | -- | Cottonwood Title Layton |
Source: Public Records
Tax History Compared to Growth
Tax History
| Year | Tax Paid | Tax Assessment Tax Assessment Total Assessment is a certain percentage of the fair market value that is determined by local assessors to be the total taxable value of land and additions on the property. | Land | Improvement |
|---|---|---|---|---|
| 2025 | $3,407 | $540,378 | $154,556 | $385,822 |
| 2024 | $3,325 | $292,049 | $85,023 | $207,026 |
| 2023 | $3,208 | $282,150 | $84,255 | $197,895 |
| 2022 | $3,094 | $277,200 | $70,496 | $206,704 |
| 2021 | $2,723 | $403,000 | $87,228 | $315,772 |
| 2020 | $2,494 | $338,000 | $87,228 | $250,772 |
| 2019 | $2,534 | $326,000 | $56,854 | $269,146 |
| 2018 | $2,322 | $281,000 | $51,735 | $229,265 |
| 2017 | $2,001 | $225,000 | $46,588 | $178,412 |
| 2016 | $2,030 | $123,922 | $25,669 | $98,253 |
| 2015 | $1,798 | $111,901 | $22,849 | $89,052 |
| 2014 | $1,810 | $111,901 | $22,849 | $89,052 |
Source: Public Records
Map
Nearby Homes