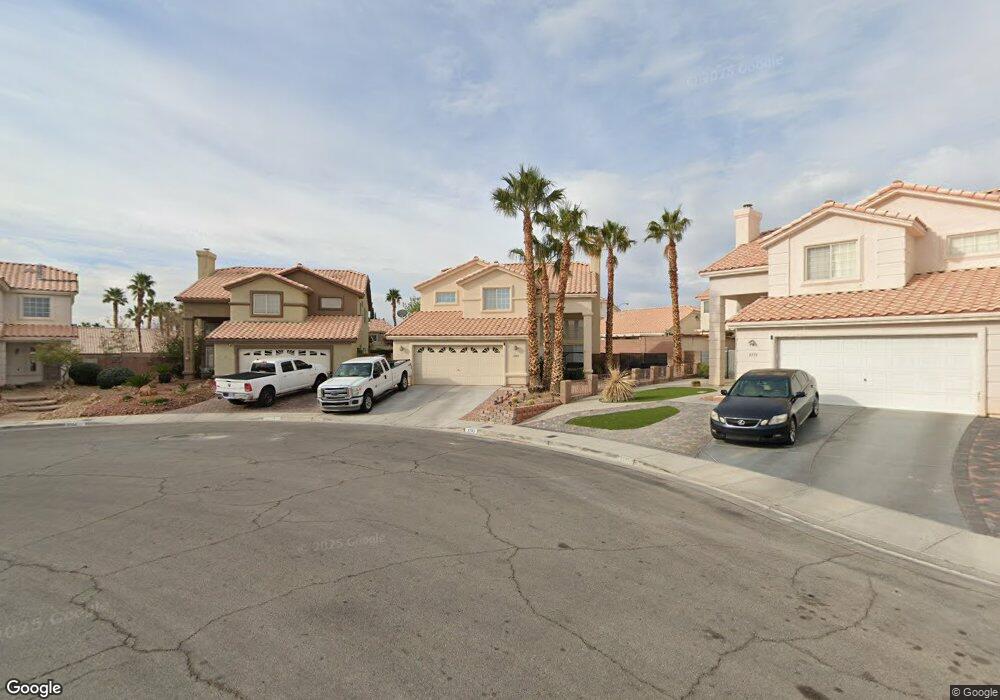
3783 Lipan Point St Las Vegas, NV 89147
Rancho Viejo NeighborhoodEstimated Value: $490,000 - $553,000
4
Beds
3
Baths
2,206
Sq Ft
$234/Sq Ft
Est. Value
About This Home
This home is located at 3783 Lipan Point St, Las Vegas, NV 89147 and is currently estimated at $516,540, approximately $234 per square foot. 3783 Lipan Point St is a home located in Clark County with nearby schools including Keith C. & Karen W. Hayes Elementary School, Victoria Fertitta Middle School, and Spring Valley High School.
Ownership History
Date
Name
Owned For
Owner Type
Purchase Details
Closed on
Jul 19, 2018
Sold by
Rosenstein Alexander and Hulevich Sviatlana
Bought by
Rosnstein Hulevich Living Trust
Current Estimated Value
Purchase Details
Closed on
Oct 7, 2005
Sold by
Ralph Mary and Ralph Anthony
Bought by
Rosentein Alexander and Hulevich Sviatlana
Home Financials for this Owner
Home Financials are based on the most recent Mortgage that was taken out on this home.
Original Mortgage
$251,900
Outstanding Balance
$138,963
Interest Rate
6.25%
Mortgage Type
Unknown
Estimated Equity
$377,577
Purchase Details
Closed on
Aug 16, 2001
Sold by
Mitlyng Michael A and Mitlyng Lisa D
Bought by
Ralph Anthony and Ralph Mary
Home Financials for this Owner
Home Financials are based on the most recent Mortgage that was taken out on this home.
Original Mortgage
$189,750
Interest Rate
7.09%
Create a Home Valuation Report for This Property
The Home Valuation Report is an in-depth analysis detailing your home's value as well as a comparison with similar homes in the area
Home Values in the Area
Average Home Value in this Area
Purchase History
| Date | Buyer | Sale Price | Title Company |
|---|---|---|---|
| Rosnstein Hulevich Living Trust | -- | None Available | |
| Rosentein Alexander | $359,900 | Equity Title Of Nevada | |
| Ralph Anthony | $199,777 | Nevada Title Company |
Source: Public Records
Mortgage History
| Date | Status | Borrower | Loan Amount |
|---|---|---|---|
| Open | Rosentein Alexander | $251,900 | |
| Previous Owner | Ralph Anthony | $189,750 |
Source: Public Records
Tax History Compared to Growth
Tax History
| Year | Tax Paid | Tax Assessment Tax Assessment Total Assessment is a certain percentage of the fair market value that is determined by local assessors to be the total taxable value of land and additions on the property. | Land | Improvement |
|---|---|---|---|---|
| 2025 | $2,455 | $111,039 | $37,450 | $73,589 |
| 2024 | $2,274 | $111,039 | $37,450 | $73,589 |
| 2023 | $2,274 | $106,314 | $36,400 | $69,914 |
| 2022 | $2,106 | $92,323 | $28,350 | $63,973 |
| 2021 | $1,950 | $86,046 | $25,200 | $60,846 |
| 2020 | $1,890 | $83,126 | $22,750 | $60,376 |
| 2019 | $1,835 | $82,312 | $22,750 | $59,562 |
| 2018 | $1,782 | $74,563 | $17,500 | $57,063 |
| 2017 | $2,179 | $74,310 | $16,450 | $57,860 |
| 2016 | $1,668 | $70,196 | $12,250 | $57,946 |
| 2015 | $1,665 | $56,130 | $9,800 | $46,330 |
| 2014 | $1,613 | $57,989 | $9,800 | $48,189 |
Source: Public Records
Map
Nearby Homes
- 3757 Horseshoe Mesa St
- 9718 Camino Capistrano Ln
- 9758 Camino Capistrano Ln
- 9615 Sedona Hills Ct
- 9545 Canyonland Ct
- 9591 Borgata Bay Blvd
- 9500 Catalina Cove Cir
- 9485 Camino Capistrano Ln Unit 1
- 9475 Sand Villa Ct
- 3905 Tropical Vine St
- 3580 Teton Hills St
- 9750 W Cherokee Ave Unit 1
- 9587 Windborne Ave
- 3772 S Jensen St
- 9605 Rainfall Ave
- 9923 Sierra Canyon Way
- 9750 Pine Thickett Ave
- 3930 Starfield Ln Unit O58
- 3891 Lilac Haze St
- 9785 Turtle Head Ct
- 9649 Maricopa Point Ave
- 3775 Lipan Point St
- 3782 Horseshoe Mesa St
- 3790 Horseshoe Mesa St
- 9641 Maricopa Point Ave
- 3767 Lipan Point St
- 3767 Lipan Point St Unit na
- 3774 Horseshoe Mesa St
- 3798 Horseshoe Mesa St
- 3766 Horseshoe Mesa St
- 9633 Maricopa Point Ave
- 3759 Lipan Point St
- 3766 Lipan Point St
- 3758 Horseshoe Mesa St
- 9621 Maricopa Point Ave
- 9621 Maricopa Point Ave Unit n/a
- 3751 Lipan Point St
- 3758 Lipan Point St
- 9677 Pima Point Ave
- 9662 Camino Capistrano Ln