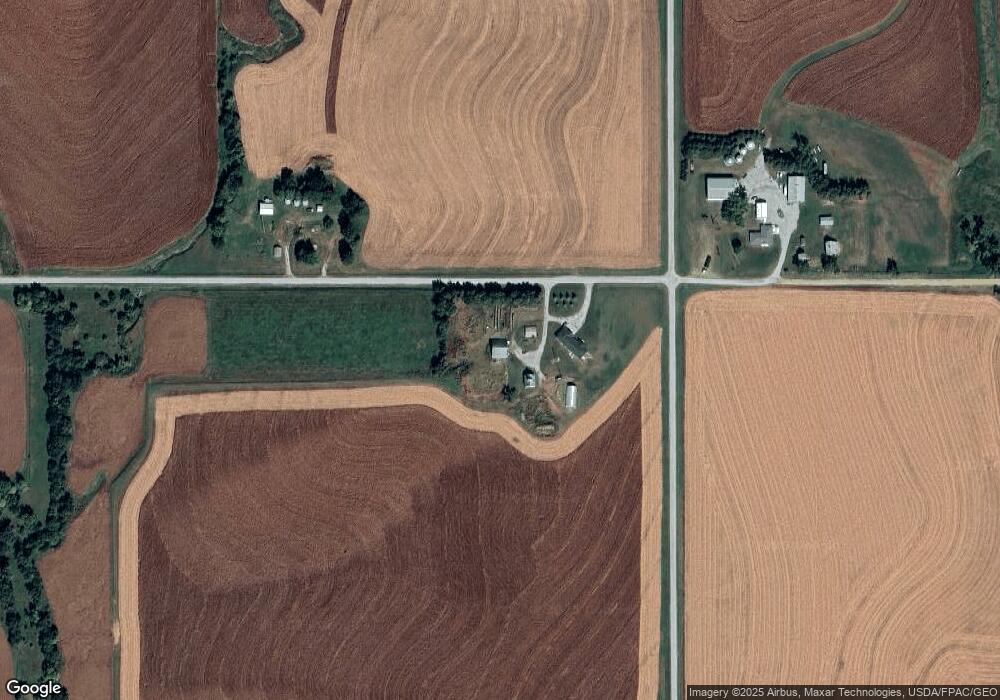
3784 L Rd Syracuse, NE 68446
Estimated Value: $322,000 - $561,000
3
Beds
2
Baths
1,830
Sq Ft
$266/Sq Ft
Est. Value
About This Home
This home is located at 3784 L Rd, Syracuse, NE 68446 and is currently estimated at $487,090, approximately $266 per square foot. 3784 L Rd is a home with nearby schools including Elementary School at Syracuse and High School at Syracuse.
Ownership History
Date
Name
Owned For
Owner Type
Purchase Details
Closed on
Aug 19, 2022
Sold by
Kuhlenengel Kelli L
Bought by
Kuhlenengel Kurt D
Current Estimated Value
Purchase Details
Closed on
Feb 19, 2021
Sold by
Gude Michael C and Gude Shirley K
Bought by
Meisinger David G and Meisinger Holly L
Home Financials for this Owner
Home Financials are based on the most recent Mortgage that was taken out on this home.
Original Mortgage
$795,000
Interest Rate
2.65%
Mortgage Type
Commercial
Create a Home Valuation Report for This Property
The Home Valuation Report is an in-depth analysis detailing your home's value as well as a comparison with similar homes in the area
Purchase History
| Date | Buyer | Sale Price | Title Company |
|---|---|---|---|
| Kuhlenengel Kurt D | -- | -- | |
| Meisinger David G | $800,000 | Nebraska Title Company |
Source: Public Records
Mortgage History
| Date | Status | Borrower | Loan Amount |
|---|---|---|---|
| Previous Owner | Meisinger David G | $795,000 |
Source: Public Records
Tax History
| Year | Tax Paid | Tax Assessment Tax Assessment Total Assessment is a certain percentage of the fair market value that is determined by local assessors to be the total taxable value of land and additions on the property. | Land | Improvement |
|---|---|---|---|---|
| 2025 | $3,138 | $358,990 | $84,326 | $274,664 |
| 2024 | $5,088 | $358,990 | $84,326 | $274,664 |
| 2023 | $5,088 | $350,920 | $76,660 | $274,260 |
| 2022 | $5,048 | $350,920 | $76,660 | $274,260 |
| 2021 | $4,898 | $350,920 | $76,660 | $274,260 |
| 2020 | $4,740 | $332,990 | $58,730 | $274,260 |
| 2019 | $418 | $29,290 | $25,250 | $4,040 |
| 2018 | $400 | $29,790 | $25,750 | $4,040 |
| 2017 | $8,059 | $577,000 | $572,960 | $4,040 |
| 2016 | $7,536 | $576,130 | $572,090 | $4,040 |
| 2015 | $7,463 | $565,060 | $561,020 | $4,040 |
| 2014 | -- | $493,470 | $489,430 | $4,040 |
| 2012 | $6,161 | $421,160 | $417,120 | $4,040 |
Source: Public Records
Map
Nearby Homes
Your Personal Tour Guide
Ask me questions while you tour the home.