Estimated Value: $412,586 - $433,000
3
Beds
1
Bath
1,084
Sq Ft
$390/Sq Ft
Est. Value
About This Home
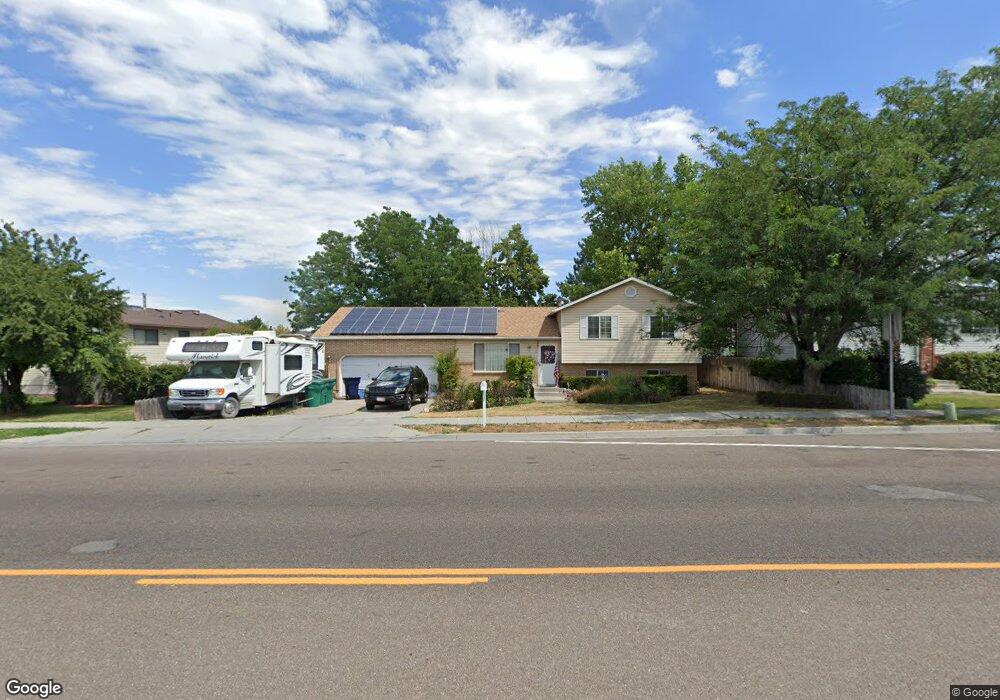
This home is located at 3786 W 5500 S, Roy, UT 84067 and is currently estimated at $422,897, approximately $390 per square foot. 3786 W 5500 S is a home located in Weber County with nearby schools including Municipal School, Roy Junior High School, and Roy High School.
Ownership History
Date
Name
Owned For
Owner Type
Purchase Details
Closed on
Aug 29, 2017
Sold by
Gertge Abby and Racker Bradley
Bought by
Tallabas Connie
Current Estimated Value
Home Financials for this Owner
Home Financials are based on the most recent Mortgage that was taken out on this home.
Original Mortgage
$159,900
Outstanding Balance
$133,743
Interest Rate
3.96%
Mortgage Type
New Conventional
Estimated Equity
$289,154
Purchase Details
Closed on
Jan 27, 2015
Sold by
Racker Michele and Racker Stanley
Bought by
Racker Stanley
Purchase Details
Closed on
Nov 18, 2011
Sold by
Racker Stanley J and Racker Michele M
Bought by
Racker Stanley J and Racker Michele M
Home Financials for this Owner
Home Financials are based on the most recent Mortgage that was taken out on this home.
Original Mortgage
$110,000
Interest Rate
4.09%
Mortgage Type
New Conventional
Purchase Details
Closed on
Dec 2, 2010
Sold by
Racker Stanley J and Racker Michele M
Bought by
Racker Stanley J and Racker Michele M
Purchase Details
Closed on
Oct 26, 2009
Sold by
Racker Stanley J and Racker Michele M
Bought by
Racker Stanley J and Racker Michele M
Home Financials for this Owner
Home Financials are based on the most recent Mortgage that was taken out on this home.
Original Mortgage
$115,000
Interest Rate
5%
Mortgage Type
New Conventional
Purchase Details
Closed on
May 9, 2005
Sold by
Racker Stanley J
Bought by
Racker Stanley J and Racker Michele M
Home Financials for this Owner
Home Financials are based on the most recent Mortgage that was taken out on this home.
Original Mortgage
$114,400
Interest Rate
5.84%
Mortgage Type
New Conventional
Purchase Details
Closed on
Jul 3, 2001
Sold by
Racker Stanley J
Bought by
Racker Stanley J and Racker Michele M
Home Financials for this Owner
Home Financials are based on the most recent Mortgage that was taken out on this home.
Original Mortgage
$113,000
Interest Rate
7.24%
Create a Home Valuation Report for This Property
The Home Valuation Report is an in-depth analysis detailing your home's value as well as a comparison with similar homes in the area
Home Values in the Area
Average Home Value in this Area
Purchase History
| Date | Buyer | Sale Price | Title Company |
|---|---|---|---|
| Tallabas Connie | -- | Founders Title Co | |
| Racker Stanley J | -- | Founders Title Co | |
| Racker Stanley | -- | None Available | |
| Racker Stanley J | -- | Mountain View Title Ogden | |
| Racker Stanley J | -- | Mountain View Title Ogden | |
| Racker Stanley J | -- | None Available | |
| Racker Stanley J | -- | Bonneville Superior Title Co | |
| Racker Stanley J | -- | Township Title | |
| Racker Stanley J | -- | Bonneville Title Company |
Source: Public Records
Mortgage History
| Date | Status | Borrower | Loan Amount |
|---|---|---|---|
| Open | Tallabas Connie | $159,900 | |
| Previous Owner | Racker Stanley J | $110,000 | |
| Previous Owner | Racker Stanley J | $115,000 | |
| Previous Owner | Racker Stanley J | $114,400 | |
| Previous Owner | Racker Stanley J | $113,000 |
Source: Public Records
Tax History Compared to Growth
Tax History
| Year | Tax Paid | Tax Assessment Tax Assessment Total Assessment is a certain percentage of the fair market value that is determined by local assessors to be the total taxable value of land and additions on the property. | Land | Improvement |
|---|---|---|---|---|
| 2025 | $2,646 | $419,986 | $133,568 | $286,418 |
| 2024 | $2,583 | $227,149 | $73,462 | $153,687 |
| 2023 | $2,588 | $228,800 | $70,191 | $158,609 |
| 2022 | $2,412 | $217,800 | $58,938 | $158,862 |
| 2021 | $2,076 | $309,000 | $81,562 | $227,438 |
| 2020 | $1,934 | $264,000 | $81,562 | $182,438 |
| 2019 | $1,841 | $236,000 | $53,661 | $182,339 |
| 2018 | $1,781 | $215,000 | $53,661 | $161,339 |
| 2017 | $1,624 | $182,000 | $53,661 | $128,339 |
| 2016 | $1,571 | $94,988 | $20,424 | $74,564 |
| 2015 | $1,326 | $80,733 | $18,860 | $61,873 |
| 2014 | $1,276 | $76,454 | $18,860 | $57,594 |
Source: Public Records
Map
Nearby Homes
- 3809 W 5625 S
- 3607 W 5400 S
- 3766 W 5300 S
- 5465 S 4050 W
- 3826 W 5750 S
- 3923 W 5700 S
- 5610 S 4075 W
- 5644 S 4075 W
- 5235 Midland Dr
- 3780 W 5850 S
- 5539 S 4175 W
- 5578 S 3450 W
- 5856 S 3950 W
- 3443 W 5200 S Unit 2&3
- 5270 S 4200 W
- 3820 Foxglen Dr
- 5859 S 3500 W
- 4309 W 5430 St #B S
- 4021 W 5000 S
- 4342 W 5430 S Unit B