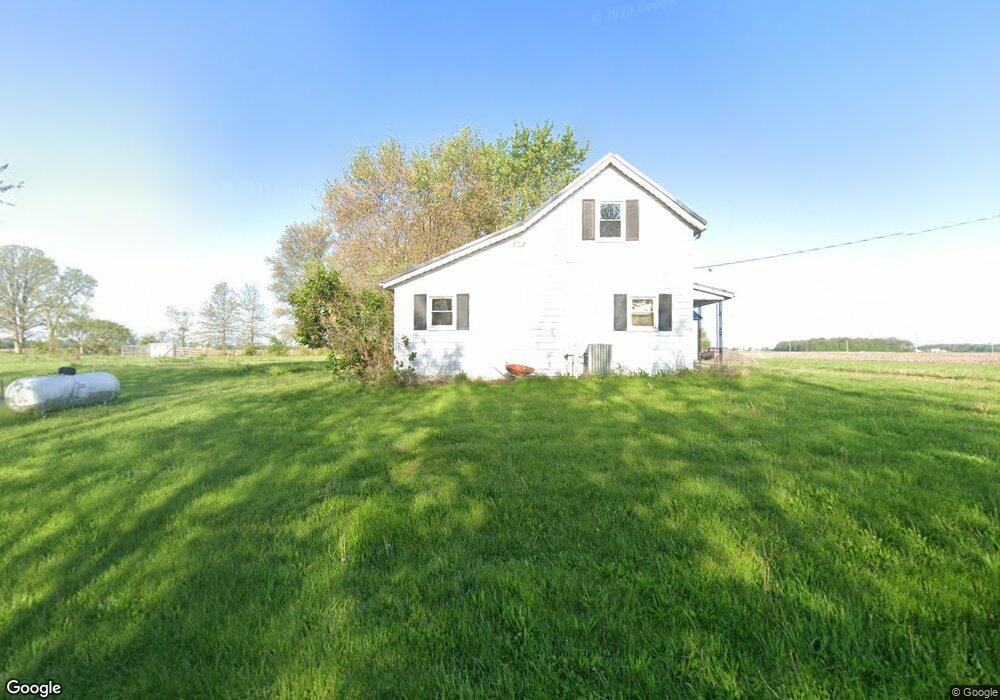
3787 Dog Leg Rd Delphos, OH 45833
Estimated Value: $189,000 - $225,000
3
Beds
1
Bath
1,716
Sq Ft
$123/Sq Ft
Est. Value
About This Home
This home is located at 3787 Dog Leg Rd, Delphos, OH 45833 and is currently estimated at $210,739, approximately $122 per square foot. 3787 Dog Leg Rd is a home located in Allen County.
Ownership History
Date
Name
Owned For
Owner Type
Purchase Details
Closed on
Oct 21, 2016
Sold by
Stone Donald R
Bought by
Elwer Jared R
Current Estimated Value
Home Financials for this Owner
Home Financials are based on the most recent Mortgage that was taken out on this home.
Original Mortgage
$95,000
Outstanding Balance
$76,112
Interest Rate
3.44%
Mortgage Type
Purchase Money Mortgage
Estimated Equity
$134,627
Purchase Details
Closed on
Oct 5, 2005
Sold by
Rhonemus Stacie D
Bought by
Stone Donald R
Home Financials for this Owner
Home Financials are based on the most recent Mortgage that was taken out on this home.
Original Mortgage
$120,250
Interest Rate
5.88%
Mortgage Type
Future Advance Clause Open End Mortgage
Purchase Details
Closed on
Jan 28, 2005
Sold by
Dray Michael B
Bought by
Rhonemus Stacie D
Home Financials for this Owner
Home Financials are based on the most recent Mortgage that was taken out on this home.
Original Mortgage
$90,300
Interest Rate
5.5%
Mortgage Type
Adjustable Rate Mortgage/ARM
Purchase Details
Closed on
Oct 1, 1977
Bought by
Dray Michael B
Create a Home Valuation Report for This Property
The Home Valuation Report is an in-depth analysis detailing your home's value as well as a comparison with similar homes in the area
Home Values in the Area
Average Home Value in this Area
Purchase History
| Date | Buyer | Sale Price | Title Company |
|---|---|---|---|
| Elwer Jared R | $120,000 | None Available | |
| Stone Donald R | $124,000 | None Available | |
| Rhonemus Stacie D | $112,900 | None Available | |
| Dray Michael B | $48,000 | -- |
Source: Public Records
Mortgage History
| Date | Status | Borrower | Loan Amount |
|---|---|---|---|
| Open | Elwer Jared R | $95,000 | |
| Previous Owner | Stone Donald R | $120,250 | |
| Previous Owner | Rhonemus Stacie D | $90,300 |
Source: Public Records
Tax History Compared to Growth
Tax History
| Year | Tax Paid | Tax Assessment Tax Assessment Total Assessment is a certain percentage of the fair market value that is determined by local assessors to be the total taxable value of land and additions on the property. | Land | Improvement |
|---|---|---|---|---|
| 2024 | $1,833 | $59,990 | $17,430 | $42,560 |
| 2023 | $1,507 | $46,520 | $13,510 | $33,010 |
| 2022 | $1,539 | $46,520 | $13,510 | $33,010 |
| 2021 | $1,543 | $46,520 | $13,510 | $33,010 |
| 2020 | $1,298 | $40,430 | $13,510 | $26,920 |
| 2019 | $1,298 | $40,430 | $13,510 | $26,920 |
| 2018 | $1,252 | $40,430 | $13,510 | $26,920 |
| 2017 | $1,220 | $37,980 | $13,510 | $24,470 |
| 2016 | $1,218 | $37,980 | $13,510 | $24,470 |
| 2015 | $1,192 | $37,980 | $13,510 | $24,470 |
| 2014 | $1,089 | $33,150 | $12,430 | $20,720 |
| 2013 | $1,089 | $33,150 | $12,430 | $20,720 |
Source: Public Records
Map
Nearby Homes
- 6726 Elida Rd
- 7180 W State Rd
- 6585 Huffer Rd
- 7110 Elida Rd
- 5550 Hartman Rd
- 3838 Kemp Rd N
- 1001 S Adams St
- 827 S Washington St
- 227 W Clime St Unit 10
- 508 S Washington St
- 634 S Clay St
- 424 S Canal St
- 633 E 2nd St
- 606 S Cass St
- 903 E 3rd St
- 821 E 3rd St
- 914 E 3rd St
- 221 S Main St
- 213 Johns Ave
- 210 E 3rd St
- 3787 Dogleg Rd
- 9633 Piquad Rd
- 4095 Defiance Trail
- 3350 Dogleg Rd
- 3851 Defiance Trail N
- 3737 Defiance Trail N
- 3225 Dogleg Rd
- 3993 Conant Rd
- 0000 Piquad Rd
- 3225 N Conant Rd
- 9151 Piquad Rd
- 4411 Defiance Trail
- 9407 Bliss Rd
- 3371 Defiance Trail
- 2960 Dogleg Rd
- 2990 Dogleg Rd
- 4343 Conant Rd
- 3325 Defiance Trail
- 9350 Bliss Rd
- 0000 Bliss Rd