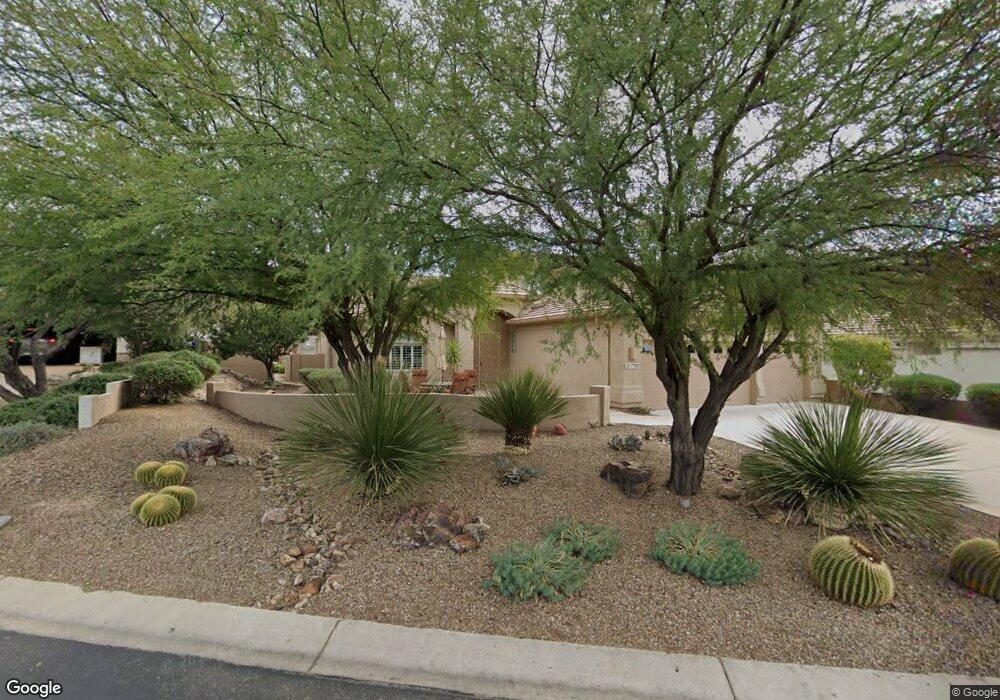
37893 S Golf Course Dr Unit 21 Tucson, AZ 85739
Estimated Value: $647,000 - $884,000
--
Bed
--
Bath
3,426
Sq Ft
$220/Sq Ft
Est. Value
About This Home
This home is located at 37893 S Golf Course Dr Unit 21, Tucson, AZ 85739 and is currently estimated at $752,313, approximately $219 per square foot. 37893 S Golf Course Dr Unit 21 is a home located in Pinal County with nearby schools including Mountain Vista School.
Ownership History
Date
Name
Owned For
Owner Type
Purchase Details
Closed on
Sep 24, 2012
Sold by
Lanasa Richard S and La Nasa Lois K
Bought by
Lanasa Richard S and La Nasa Lois K
Current Estimated Value
Home Financials for this Owner
Home Financials are based on the most recent Mortgage that was taken out on this home.
Original Mortgage
$252,500
Outstanding Balance
$175,506
Interest Rate
3.59%
Mortgage Type
New Conventional
Estimated Equity
$576,807
Purchase Details
Closed on
Apr 11, 2006
Sold by
Lanasa Richard S and La Nasa Lois K
Bought by
Lanasa Richard S and La Nasa Lois K
Purchase Details
Closed on
Nov 4, 2003
Sold by
Saddlbrooke Development Co
Bought by
Lanasa Richard S and Lanasa Lois K
Home Financials for this Owner
Home Financials are based on the most recent Mortgage that was taken out on this home.
Original Mortgage
$190,000
Interest Rate
5.57%
Mortgage Type
New Conventional
Create a Home Valuation Report for This Property
The Home Valuation Report is an in-depth analysis detailing your home's value as well as a comparison with similar homes in the area
Home Values in the Area
Average Home Value in this Area
Purchase History
| Date | Buyer | Sale Price | Title Company |
|---|---|---|---|
| Lanasa Richard S | -- | Accommodation | |
| Lanasa Richard S | -- | Fidelity National Title Agen | |
| Lanasa Richard S | -- | None Available | |
| Lanasa Richard S | $489,651 | -- |
Source: Public Records
Mortgage History
| Date | Status | Borrower | Loan Amount |
|---|---|---|---|
| Open | Lanasa Richard S | $252,500 | |
| Previous Owner | Lanasa Richard S | $190,000 | |
| Closed | Lanasa Richard S | $110,000 |
Source: Public Records
Tax History Compared to Growth
Tax History
| Year | Tax Paid | Tax Assessment Tax Assessment Total Assessment is a certain percentage of the fair market value that is determined by local assessors to be the total taxable value of land and additions on the property. | Land | Improvement |
|---|---|---|---|---|
| 2025 | $4,331 | $59,479 | -- | -- |
| 2024 | $4,417 | $59,988 | -- | -- |
| 2023 | $4,417 | $47,724 | $12,500 | $35,224 |
| 2022 | $4,112 | $39,292 | $12,500 | $26,792 |
| 2021 | $4,001 | $35,852 | $0 | $0 |
| 2020 | $4,145 | $36,173 | $0 | $0 |
| 2019 | $3,967 | $35,695 | $0 | $0 |
| 2018 | $3,943 | $35,221 | $0 | $0 |
| 2017 | $4,189 | $36,305 | $0 | $0 |
| 2016 | $4,140 | $36,801 | $12,500 | $24,301 |
| 2014 | $4,327 | $38,050 | $12,500 | $25,550 |
Source: Public Records
Map
Nearby Homes
- 37850 S Golf Course Dr
- 37999 S Spoon Dr
- 65885 E Desert Ridge Dr Unit 12
- 65873 E Desert Ridge Dr
- 38192 S Arroyo Way
- 37530 S Ocotillo Canyon Dr Unit 21
- 38322 S Golf Course Dr
- 65525 E Canyon Dr
- 37632 S Mashie Dr
- 37757 S Mashie Dr Unit 11
- 65739 E Desert Rise Dr
- 37970 S Elbow Bend Dr
- 38180 S Birdie Dr Unit 5
- 65690 E Desert Rise Dr
- 37429 S Stoney Cliff Dr
- 37233 S Golf Course Dr
- 65168 E Brassie Dr
- 65156 E Brassie Dr
- 37960 S Rolling Hills Dr
- 65639 E Stoney Ridge Dr
- 37913 S Golf Course Dr
- 37873 S Golf Course Dr Unit 21
- 37853 S Golf Course Dr
- 37933 S Golf Course Dr Unit 21
- 37833 S Golf Course Dr Unit 21
- 37951 S Golf Course Dr
- 37813 S Golf Course Dr
- 37832 S Golf Course Dr
- 37969 S Golf Course Dr Unit 12
- 37793 S Golf Course Dr
- 37814 S Golf Course Dr
- 37796 S Golf Course Dr
- 38002 S Golf Course Dr Unit 9
- 37773 S Golf Course Dr
- 66065 E Cleek Dr
- 38019 S Golf Course Dr
- 66103 E Cleek Dr Unit 21
- 37778 S Golf Course Dr Unit 12
- 38018 S Golf Course Dr
- 37753 S Golf Course Dr Unit 21