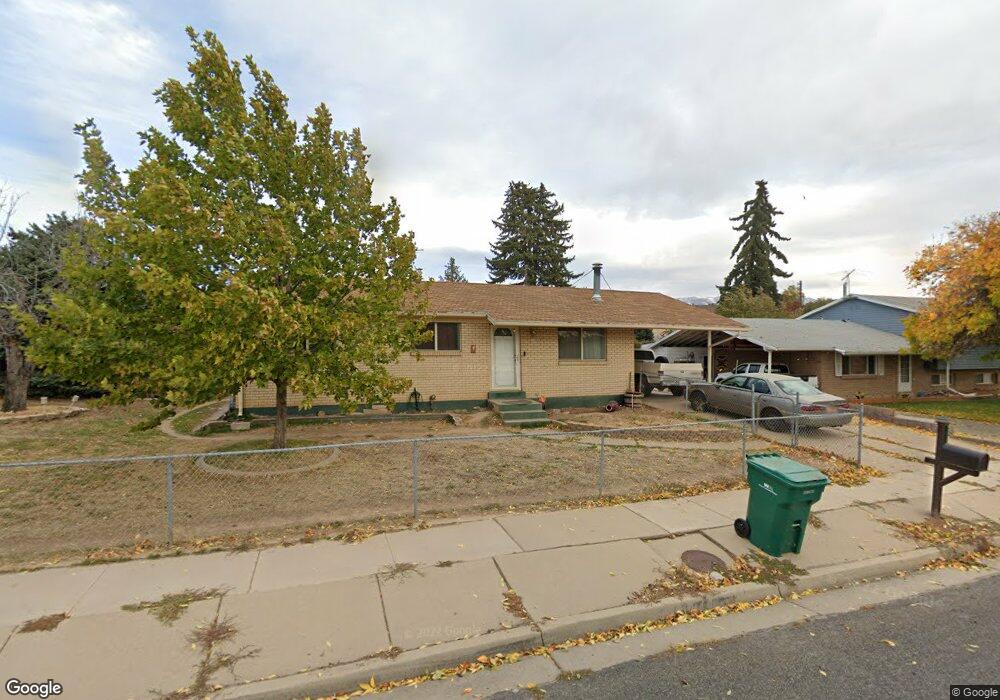
379 Barlow St Clearfield, UT 84015
Estimated Value: $348,000 - $398,396
5
Beds
1
Bath
2,000
Sq Ft
$189/Sq Ft
Est. Value
About This Home
This home is located at 379 Barlow St, Clearfield, UT 84015 and is currently estimated at $377,599, approximately $188 per square foot. 379 Barlow St is a home located in Davis County with nearby schools including Holt Elementary School, North Davis Junior High School, and Clearfield High School.
Ownership History
Date
Name
Owned For
Owner Type
Purchase Details
Closed on
Apr 29, 2025
Sold by
Banded Properties Llc
Bought by
Hankinson Amber and Hankinson Doug
Current Estimated Value
Home Financials for this Owner
Home Financials are based on the most recent Mortgage that was taken out on this home.
Original Mortgage
$232,750
Outstanding Balance
$231,721
Interest Rate
6.67%
Mortgage Type
New Conventional
Estimated Equity
$145,878
Purchase Details
Closed on
Jan 18, 2024
Sold by
Hankinson Amber Ruth
Bought by
Banded Properties Llc
Home Financials for this Owner
Home Financials are based on the most recent Mortgage that was taken out on this home.
Original Mortgage
$65,685
Interest Rate
7.03%
Mortgage Type
New Conventional
Purchase Details
Closed on
Nov 8, 2018
Sold by
Carter Charles Reeser and Carter Theresa Ann
Bought by
Hankinson Amber Ruth
Home Financials for this Owner
Home Financials are based on the most recent Mortgage that was taken out on this home.
Original Mortgage
$146,000
Interest Rate
4.7%
Mortgage Type
New Conventional
Create a Home Valuation Report for This Property
The Home Valuation Report is an in-depth analysis detailing your home's value as well as a comparison with similar homes in the area
Home Values in the Area
Average Home Value in this Area
Purchase History
| Date | Buyer | Sale Price | Title Company |
|---|---|---|---|
| Hankinson Amber | -- | Real Advantage Title | |
| Hankinson Amber | -- | Real Advantage Title | |
| Banded Properties Llc | -- | Real Advantage Title | |
| Hankinson Amber Ruth | -- | Old Republic National Title |
Source: Public Records
Mortgage History
| Date | Status | Borrower | Loan Amount |
|---|---|---|---|
| Open | Hankinson Amber | $232,750 | |
| Closed | Hankinson Amber | $232,750 | |
| Previous Owner | Banded Properties Llc | $65,685 | |
| Previous Owner | Hankinson Amber Ruth | $146,000 |
Source: Public Records
Tax History Compared to Growth
Tax History
| Year | Tax Paid | Tax Assessment Tax Assessment Total Assessment is a certain percentage of the fair market value that is determined by local assessors to be the total taxable value of land and additions on the property. | Land | Improvement |
|---|---|---|---|---|
| 2025 | $2,111 | $189,200 | $78,453 | $110,747 |
| 2024 | $2,059 | $185,899 | $74,928 | $110,971 |
| 2023 | $1,895 | $314,000 | $118,876 | $195,124 |
| 2022 | $2,062 | $184,800 | $67,097 | $117,703 |
| 2021 | $1,957 | $265,000 | $76,665 | $188,335 |
| 2020 | $1,703 | $229,000 | $65,505 | $163,495 |
| 2019 | $1,590 | $211,000 | $64,920 | $146,080 |
| 2018 | $1,477 | $191,000 | $57,623 | $133,377 |
| 2016 | $1,263 | $85,415 | $23,373 | $62,042 |
| 2015 | $1,226 | $79,035 | $23,373 | $55,662 |
| 2014 | $1,189 | $77,646 | $23,373 | $54,273 |
| 2013 | $875 | $54,631 | $25,394 | $29,237 |
Source: Public Records
Map
Nearby Homes