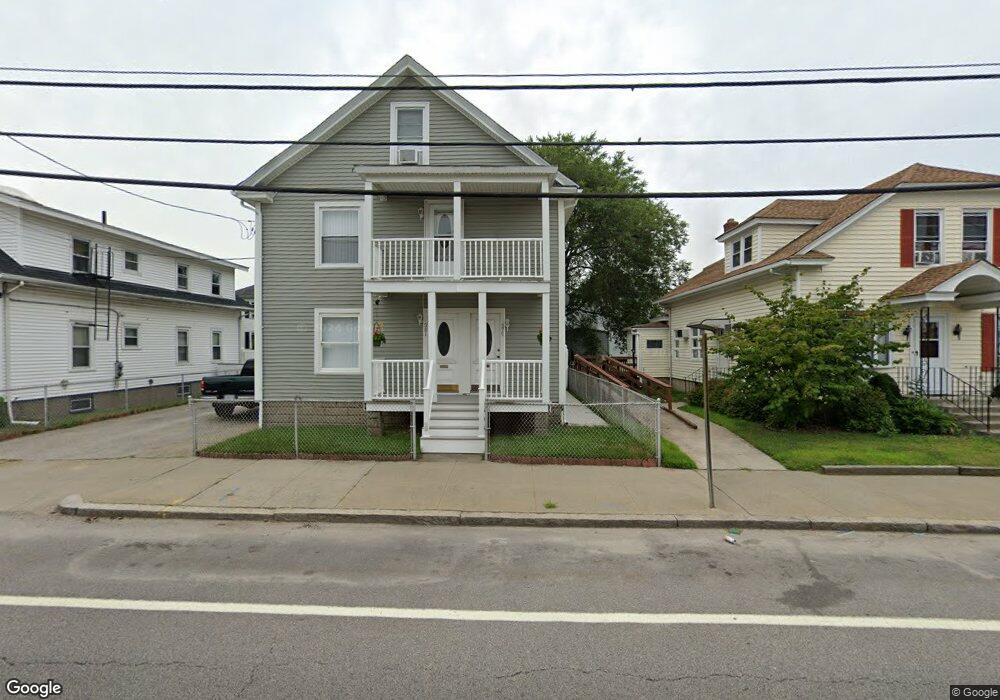
379 Benefit St Pawtucket, RI 02861
Darlington NeighborhoodEstimated Value: $419,003 - $602,000
6
Beds
2
Baths
1,976
Sq Ft
$259/Sq Ft
Est. Value
About This Home
This home is located at 379 Benefit St, Pawtucket, RI 02861 and is currently estimated at $512,501, approximately $259 per square foot. 379 Benefit St is a home located in Providence County with nearby schools including St Cecilia School and Dayspring Christian Academy.
Ownership History
Date
Name
Owned For
Owner Type
Purchase Details
Closed on
Nov 19, 2004
Sold by
Loiselle David and Loiselle Diana
Bought by
Ortega Luz Marisol and Izurieta Juan
Current Estimated Value
Home Financials for this Owner
Home Financials are based on the most recent Mortgage that was taken out on this home.
Original Mortgage
$245,000
Interest Rate
5.8%
Mortgage Type
Purchase Money Mortgage
Create a Home Valuation Report for This Property
The Home Valuation Report is an in-depth analysis detailing your home's value as well as a comparison with similar homes in the area
Home Values in the Area
Average Home Value in this Area
Purchase History
| Date | Buyer | Sale Price | Title Company |
|---|---|---|---|
| Ortega Luz Marisol | $245,000 | -- |
Source: Public Records
Mortgage History
| Date | Status | Borrower | Loan Amount |
|---|---|---|---|
| Open | Ortega Luz Marisol | $280,533 | |
| Closed | Ortega Luz Marisol | $17,451 | |
| Closed | Ortega Luz Marisol | $245,000 |
Source: Public Records
Tax History
| Year | Tax Paid | Tax Assessment Tax Assessment Total Assessment is a certain percentage of the fair market value that is determined by local assessors to be the total taxable value of land and additions on the property. | Land | Improvement |
|---|---|---|---|---|
| 2025 | $4,960 | $377,200 | $108,700 | $268,500 |
| 2024 | $4,655 | $377,200 | $108,700 | $268,500 |
| 2023 | $4,640 | $273,900 | $83,800 | $190,100 |
| 2022 | $4,541 | $273,900 | $83,800 | $190,100 |
| 2021 | $4,541 | $273,900 | $83,800 | $190,100 |
| 2020 | $3,848 | $184,200 | $58,000 | $126,200 |
| 2019 | $3,848 | $184,200 | $58,000 | $126,200 |
| 2018 | $3,708 | $184,200 | $58,000 | $126,200 |
| 2017 | $3,276 | $144,200 | $44,200 | $100,000 |
| 2016 | $3,157 | $144,200 | $44,200 | $100,000 |
| 2015 | $3,157 | $144,200 | $44,200 | $100,000 |
| 2014 | $3,127 | $135,600 | $44,200 | $91,400 |
Source: Public Records
Map
Nearby Homes
- 489 Benefit St
- 41 Calder St
- 39 Clinton St
- 34 Tweed St
- 49 Ames St
- 83 Chaplin St
- 362 Kenyon Ave
- 548 Kenyon Ave Unit 25
- 548 Kenyon Ave Unit 4
- 34 Elmcrest Dr
- 26 Blackburn St
- 57 Cedarbrook Rd
- 65 Cedarbrook Rd
- 39 Chaplin St
- 0 Cedar St
- 884 Central Ave
- 882 Central Ave
- 15 Draper St
- 888 Central Ave
- 886 Central Ave
Your Personal Tour Guide
Ask me questions while you tour the home.