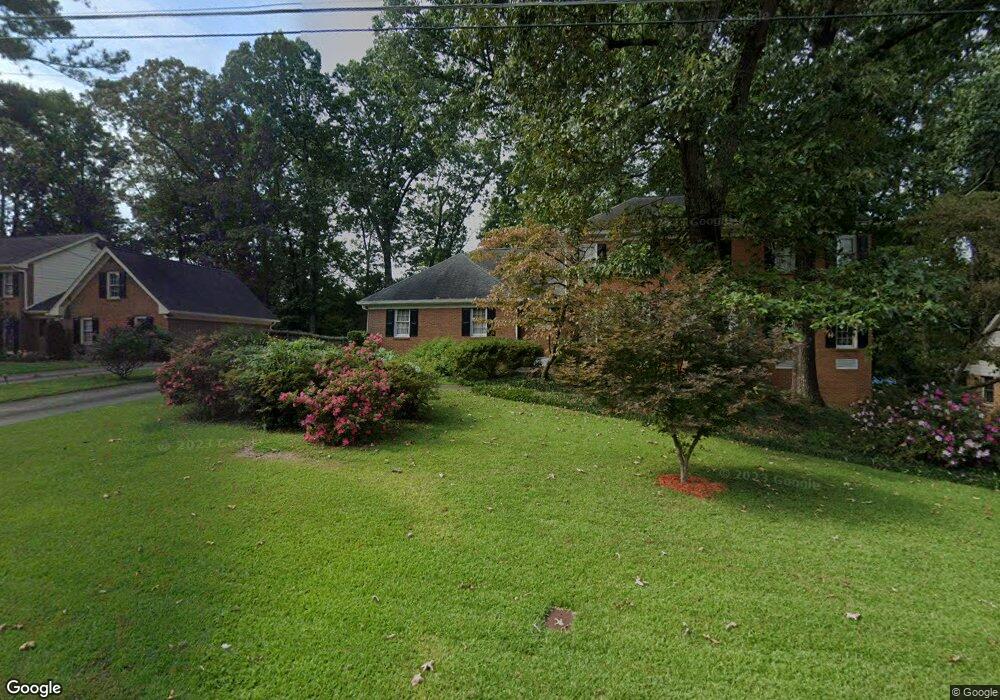
379 Brookshire Dr SW Unit 1 Lilburn, GA 30047
Estimated Value: $478,441 - $528,000
5
Beds
4
Baths
2,723
Sq Ft
$187/Sq Ft
Est. Value
About This Home
This home is located at 379 Brookshire Dr SW Unit 1, Lilburn, GA 30047 and is currently estimated at $510,110, approximately $187 per square foot. 379 Brookshire Dr SW Unit 1 is a home located in Gwinnett County with nearby schools including Knight Elementary School, Trickum Middle School, and Parkview High School.
Ownership History
Date
Name
Owned For
Owner Type
Purchase Details
Closed on
Jan 22, 2007
Sold by
Cwabs Inc Asset-Backed Certifi
Bought by
Ashby Glenton and Ashby Marvel
Current Estimated Value
Home Financials for this Owner
Home Financials are based on the most recent Mortgage that was taken out on this home.
Original Mortgage
$183,920
Outstanding Balance
$108,554
Interest Rate
6.08%
Mortgage Type
New Conventional
Estimated Equity
$401,556
Purchase Details
Closed on
Nov 7, 2006
Sold by
Barnes Wilford L
Bought by
Bank Of Ny
Purchase Details
Closed on
Jul 22, 2005
Sold by
Breland James E and Breland Emily
Bought by
Barnes Wilford L
Home Financials for this Owner
Home Financials are based on the most recent Mortgage that was taken out on this home.
Original Mortgage
$311,900
Interest Rate
7.1%
Mortgage Type
New Conventional
Create a Home Valuation Report for This Property
The Home Valuation Report is an in-depth analysis detailing your home's value as well as a comparison with similar homes in the area
Home Values in the Area
Average Home Value in this Area
Purchase History
| Date | Buyer | Sale Price | Title Company |
|---|---|---|---|
| Ashby Glenton | $229,900 | -- | |
| Bank Of Ny | $326,354 | -- | |
| Barnes Wilford L | $311,900 | -- |
Source: Public Records
Mortgage History
| Date | Status | Borrower | Loan Amount |
|---|---|---|---|
| Open | Ashby Glenton | $183,920 | |
| Previous Owner | Barnes Wilford L | $311,900 |
Source: Public Records
Tax History Compared to Growth
Tax History
| Year | Tax Paid | Tax Assessment Tax Assessment Total Assessment is a certain percentage of the fair market value that is determined by local assessors to be the total taxable value of land and additions on the property. | Land | Improvement |
|---|---|---|---|---|
| 2025 | $5,249 | $175,880 | $30,000 | $145,880 |
| 2024 | $4,285 | $186,000 | $30,000 | $156,000 |
| 2023 | $4,285 | $123,200 | $23,440 | $99,760 |
| 2022 | $4,245 | $123,200 | $23,440 | $99,760 |
| 2021 | $4,307 | $131,400 | $23,440 | $107,960 |
| 2020 | $4,012 | $108,240 | $19,520 | $88,720 |
| 2019 | $3,875 | $108,240 | $19,520 | $88,720 |
| 2018 | $3,515 | $108,240 | $16,000 | $92,240 |
| 2016 | $2,983 | $80,000 | $16,000 | $64,000 |
| 2015 | $3,012 | $80,000 | $16,000 | $64,000 |
| 2014 | $2,672 | $70,040 | $13,600 | $56,440 |
Source: Public Records
Map
Nearby Homes
- 287 Willow Cove Ct
- 3730 Willow Mill Dr
- 234 Shadow Lake Dr SW
- 522 Foxmoor Dr SW Unit 1
- 453 James St SW
- 312 Westminister Ln SW
- 564 Deer Run SW
- 167 Lester Rd SW Unit 1
- 3900 Safehaven Dr
- 565 James St SW Unit 10
- 5453 Plain Field Ln
- 445 Bruce Way SW
- 156 Round Pond Dr
- 478 Dorsey Cir SW
- 3718 Jackson Bluff Dr
- 246 Round Pond Dr
- 4239 River Branch Way
- 753 Brookwood Terrace SW
- 367 Brookshire Dr SW
- 391 Brookshire Dr SW
- 391 Brookshire Dr SW Unit 391
- 0 Brookshire Dr SW Unit 8503080
- 0 Brookshire Dr SW Unit 7469961
- 0 Brookshire Dr SW Unit 8475775
- 0 Brookshire Dr SW Unit 8138283
- 0 Brookshire Dr SW Unit 8002816
- 380 Cardigan Cir SW Unit 1
- 390 Cardigan Cir SW
- 403 Brookshire Dr SW Unit 1
- 355 Brookshire Dr SW
- 370 Cardigan Cir SW
- 380 Brookshire Dr SW
- 368 Brookshire Dr SW
- 392 Brookshire Dr SW
- 400 Cardigan Cir SW
- 360 Cardigan Cir SW
- 356 Brookshire Dr SW
- 404 Brookshire Dr SW