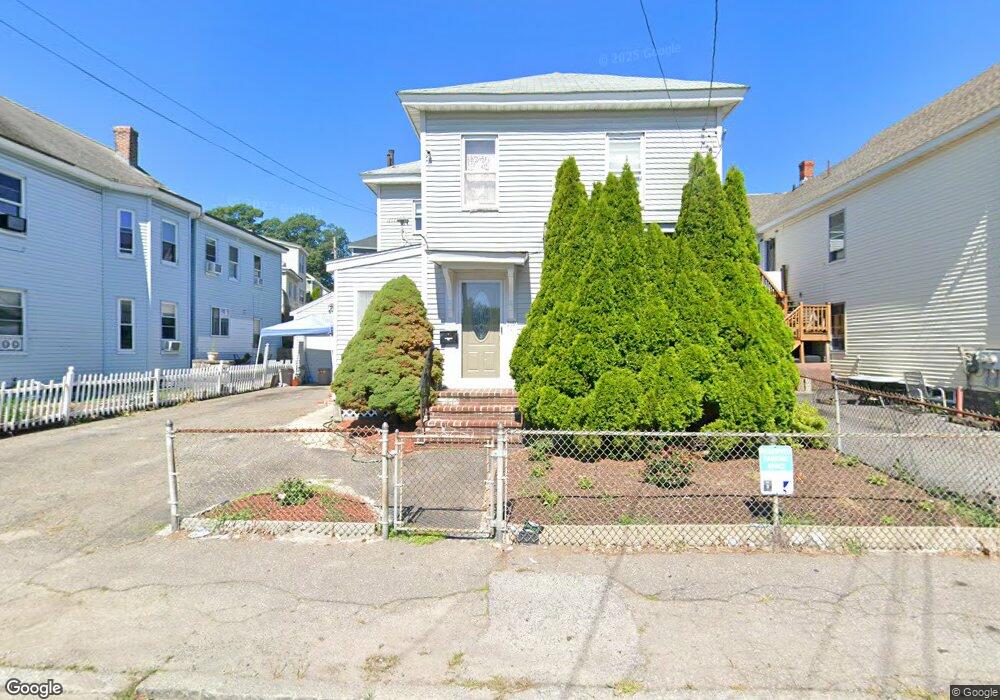
379 Chelmsford St Lowell, MA 01851
Lower Highlands NeighborhoodEstimated Value: $448,000 - $473,000
4
Beds
1
Bath
1,455
Sq Ft
$316/Sq Ft
Est. Value
About This Home
This home is located at 379 Chelmsford St, Lowell, MA 01851 and is currently estimated at $459,600, approximately $315 per square foot. 379 Chelmsford St is a home located in Middlesex County with nearby schools including Abraham Lincoln Elementary School, Charles W. Morey Elementary School, and Dr. Gertrude Bailey Elementary School.
Ownership History
Date
Name
Owned For
Owner Type
Purchase Details
Closed on
Dec 27, 1993
Sold by
Lomas Mtg Usa Inc
Bought by
Bourne Nickleous E and Bourne Anett P
Current Estimated Value
Purchase Details
Closed on
Aug 11, 1993
Sold by
Stratton Elmer B
Bought by
Lomas Mtg Usa Inc
Purchase Details
Closed on
May 20, 1987
Sold by
Weiner Jerold M
Bought by
Stratton Elmer B
Create a Home Valuation Report for This Property
The Home Valuation Report is an in-depth analysis detailing your home's value as well as a comparison with similar homes in the area
Home Values in the Area
Average Home Value in this Area
Purchase History
| Date | Buyer | Sale Price | Title Company |
|---|---|---|---|
| Bourne Nickleous E | $22,000 | -- | |
| Bourne Nickleous E | $22,000 | -- | |
| Lomas Mtg Usa Inc | $79,598 | -- | |
| Lomas Mtg Usa Inc | $79,598 | -- | |
| Stratton Elmer B | $94,000 | -- |
Source: Public Records
Mortgage History
| Date | Status | Borrower | Loan Amount |
|---|---|---|---|
| Open | Stratton Elmer B | $30,000 | |
| Closed | Stratton Elmer B | $20,000 | |
| Closed | Stratton Elmer B | $17,000 |
Source: Public Records
Tax History Compared to Growth
Tax History
| Year | Tax Paid | Tax Assessment Tax Assessment Total Assessment is a certain percentage of the fair market value that is determined by local assessors to be the total taxable value of land and additions on the property. | Land | Improvement |
|---|---|---|---|---|
| 2025 | $4,498 | $391,800 | $109,200 | $282,600 |
| 2024 | $4,389 | $368,500 | $102,100 | $266,400 |
| 2023 | $4,147 | $333,900 | $88,800 | $245,100 |
| 2022 | $3,702 | $291,700 | $70,100 | $221,600 |
| 2021 | $3,458 | $256,900 | $61,000 | $195,900 |
| 2020 | $3,301 | $247,100 | $61,000 | $186,100 |
| 2019 | $3,051 | $217,300 | $58,000 | $159,300 |
| 2018 | $2,984 | $207,400 | $55,300 | $152,100 |
| 2017 | $2,942 | $197,200 | $53,600 | $143,600 |
| 2016 | $2,665 | $175,800 | $49,700 | $126,100 |
| 2015 | $2,576 | $166,400 | $49,700 | $116,700 |
| 2013 | $2,385 | $158,900 | $59,700 | $99,200 |
Source: Public Records
Map
Nearby Homes