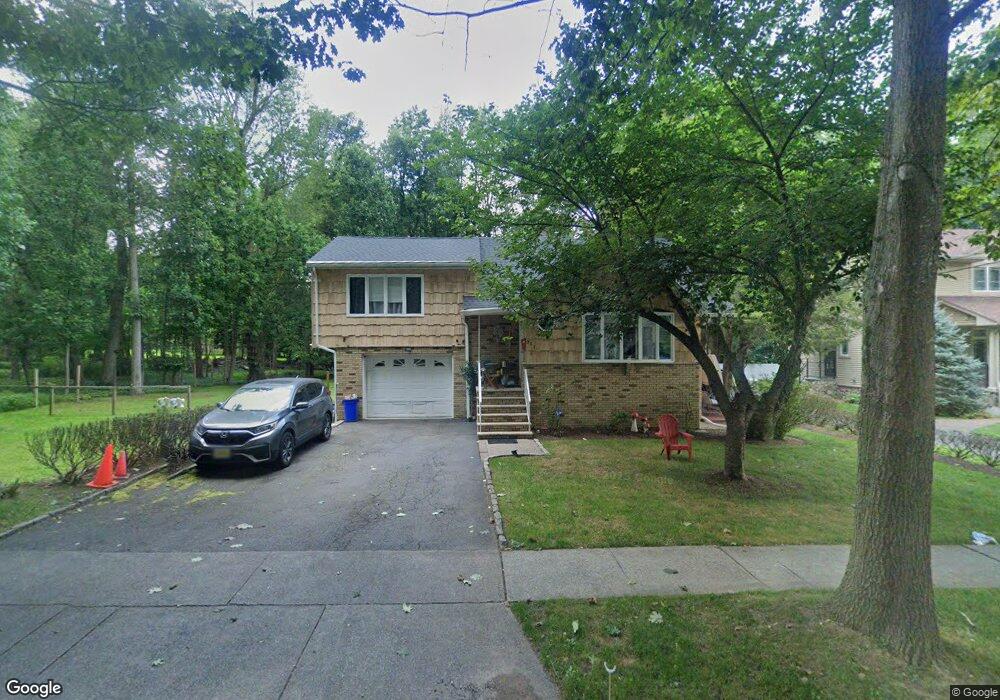
379 Durie Ave Closter, NJ 07624
Estimated Value: $847,000 - $978,000
3
Beds
2
Baths
2,111
Sq Ft
$430/Sq Ft
Est. Value
About This Home
This home is located at 379 Durie Ave, Closter, NJ 07624 and is currently estimated at $907,553, approximately $429 per square foot. 379 Durie Ave is a home located in Bergen County with nearby schools including Hillside Elementary School, Tenakill Middle School, and Northern Valley Regional High School at Demarest.
Ownership History
Date
Name
Owned For
Owner Type
Purchase Details
Closed on
Sep 28, 2020
Sold by
U S Bank National Association
Bought by
Isisaglam Abdullah T and Isisaglam Ebru Ferda
Current Estimated Value
Home Financials for this Owner
Home Financials are based on the most recent Mortgage that was taken out on this home.
Original Mortgage
$509,200
Interest Rate
2.67%
Mortgage Type
New Conventional
Purchase Details
Closed on
Jan 30, 2019
Sold by
Cureton Anthony
Bought by
Us Bank Na Tr
Purchase Details
Closed on
Jul 26, 2005
Sold by
Reeves Harold
Bought by
Choi Thomas and Park So Hyun
Home Financials for this Owner
Home Financials are based on the most recent Mortgage that was taken out on this home.
Original Mortgage
$457,500
Interest Rate
5.63%
Create a Home Valuation Report for This Property
The Home Valuation Report is an in-depth analysis detailing your home's value as well as a comparison with similar homes in the area
Home Values in the Area
Average Home Value in this Area
Purchase History
| Date | Buyer | Sale Price | Title Company |
|---|---|---|---|
| Isisaglam Abdullah T | $536,100 | Novare National Setmnt Svc | |
| Us Bank Na Tr | -- | -- | |
| Choi Thomas | $610,000 | -- |
Source: Public Records
Mortgage History
| Date | Status | Borrower | Loan Amount |
|---|---|---|---|
| Previous Owner | Isisaglam Abdullah T | $509,200 | |
| Previous Owner | Choi Thomas | $457,500 |
Source: Public Records
Tax History
| Year | Tax Paid | Tax Assessment Tax Assessment Total Assessment is a certain percentage of the fair market value that is determined by local assessors to be the total taxable value of land and additions on the property. | Land | Improvement |
|---|---|---|---|---|
| 2025 | $13,999 | $758,400 | $489,300 | $269,100 |
| 2024 | $13,509 | $661,600 | $406,000 | $255,600 |
| 2023 | $12,825 | $630,100 | $381,300 | $248,800 |
| 2022 | $12,825 | $579,800 | $344,200 | $235,600 |
| 2021 | $12,723 | $552,200 | $328,400 | $223,800 |
| 2020 | $12,485 | $557,100 | $331,600 | $225,500 |
| 2019 | $12,185 | $549,600 | $327,500 | $222,100 |
| 2018 | $12,081 | $542,700 | $323,900 | $218,800 |
| 2017 | $12,022 | $526,800 | $309,300 | $217,500 |
| 2016 | $11,795 | $526,800 | $309,300 | $217,500 |
| 2015 | $11,537 | $526,800 | $309,300 | $217,500 |
| 2014 | $11,216 | $526,800 | $309,300 | $217,500 |
Source: Public Records
Map
Nearby Homes
Your Personal Tour Guide
Ask me questions while you tour the home.