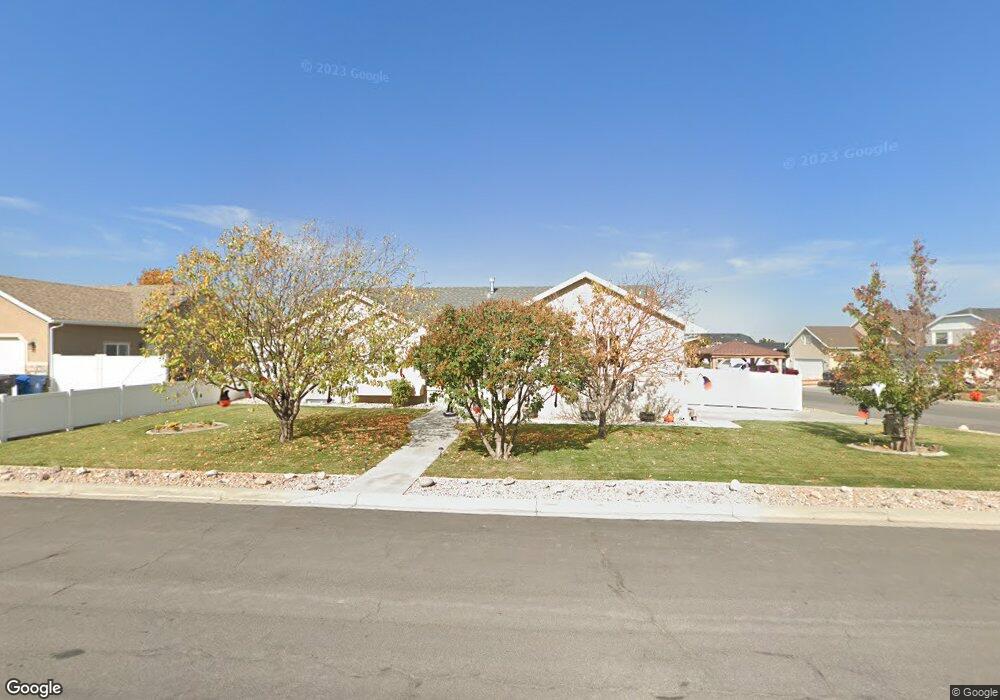
379 E 1050 S Unit 6 Payson, UT 84651
Estimated Value: $516,000 - $566,000
3
Beds
3
Baths
1,411
Sq Ft
$385/Sq Ft
Est. Value
About This Home
This home is located at 379 E 1050 S Unit 6, Payson, UT 84651 and is currently estimated at $542,996, approximately $384 per square foot. 379 E 1050 S Unit 6 is a home located in Utah County with nearby schools including Park View Elementary, Payson High School, and Payson Junior High School.
Ownership History
Date
Name
Owned For
Owner Type
Purchase Details
Closed on
Jul 21, 2022
Sold by
Oryall Burke R
Bought by
Gordon Neva and Rider Randilee
Current Estimated Value
Home Financials for this Owner
Home Financials are based on the most recent Mortgage that was taken out on this home.
Original Mortgage
$337,000
Outstanding Balance
$322,525
Interest Rate
5.81%
Mortgage Type
Balloon
Estimated Equity
$220,471
Purchase Details
Closed on
Jul 9, 2010
Sold by
Long Gene and Arneson Susan
Bought by
Oryall Burke R
Home Financials for this Owner
Home Financials are based on the most recent Mortgage that was taken out on this home.
Original Mortgage
$169,900
Interest Rate
4.68%
Mortgage Type
New Conventional
Purchase Details
Closed on
Jul 8, 2005
Sold by
Hall Wayne R
Bought by
Long Gene and Arneson Susan
Purchase Details
Closed on
Apr 19, 2004
Sold by
Georgetown Development Inc
Bought by
Hall Wayne R
Create a Home Valuation Report for This Property
The Home Valuation Report is an in-depth analysis detailing your home's value as well as a comparison with similar homes in the area
Home Values in the Area
Average Home Value in this Area
Purchase History
| Date | Buyer | Sale Price | Title Company |
|---|---|---|---|
| Gordon Neva | -- | Stewart Title | |
| Oryall Burke R | -- | Gt Title Services Spanish | |
| Long Gene | -- | Century Title Company | |
| Hall Wayne R | -- | First American Title Agency |
Source: Public Records
Mortgage History
| Date | Status | Borrower | Loan Amount |
|---|---|---|---|
| Open | Gordon Neva | $337,000 | |
| Previous Owner | Oryall Burke R | $169,900 |
Source: Public Records
Tax History
| Year | Tax Paid | Tax Assessment Tax Assessment Total Assessment is a certain percentage of the fair market value that is determined by local assessors to be the total taxable value of land and additions on the property. | Land | Improvement |
|---|---|---|---|---|
| 2025 | $2,508 | $266,200 | -- | -- |
| 2024 | $2,508 | $255,200 | $0 | $0 |
| 2023 | $2,562 | $261,415 | $0 | $0 |
| 2022 | $2,576 | $258,555 | $0 | $0 |
| 2021 | $2,175 | $350,100 | $100,100 | $250,000 |
| 2020 | $2,064 | $325,100 | $91,000 | $234,100 |
| 2019 | $1,899 | $306,600 | $86,700 | $219,900 |
| 2018 | $1,708 | $265,800 | $74,600 | $191,200 |
| 2017 | $1,615 | $135,190 | $0 | $0 |
| 2016 | $1,507 | $125,345 | $0 | $0 |
| 2015 | $1,452 | $119,900 | $0 | $0 |
| 2014 | $1,250 | $103,950 | $0 | $0 |
Source: Public Records
Map
Nearby Homes
- 288 E 900 S
- 876 Greenridge Ave
- 252 E 670 S Unit 2
- 229 E 670 S Unit 7
- 420 E 600 S
- 389 E 1290 S
- 336 E 1330 S
- 549 S Main St
- 1836 S 100 E
- 347 W 1380 S
- 1463 S 260 W
- 862 E 400 S
- 412 S Goosenest Dr
- 426 S Goosenest Dr
- 252 S 400 E
- 862 E 200 S
- 753 N Emery Ln Unit 57
- 678 N Mountain View Dr
- 552 E Longview Dr Unit 29
- 348 E Dr E Unit 26
- 379 E 1050 S
- 367 E 1050 S
- 367 E 1050 S Unit 5
- 987 Greenridge Ave
- 987 Greenridge Ave Unit 18
- 1054 Greenridge Ave
- 1054 Greenridge Ave Unit 32
- 372 E 1050 S
- 372 E 1050 S Unit 31
- 351 E 1050 S
- 351 E 1050 S Unit 4
- 1027 Greenridge Ave
- 366 E 950 S
- 366 E 950 S
- 366 E 950 S Unit 86
- 364 E 950 S
- 364 E 950 S Unit 87
- 975 Greenridge Ave
- 975 Greenridge Ave Unit 17
- 362 E 950 S
Your Personal Tour Guide
Ask me questions while you tour the home.