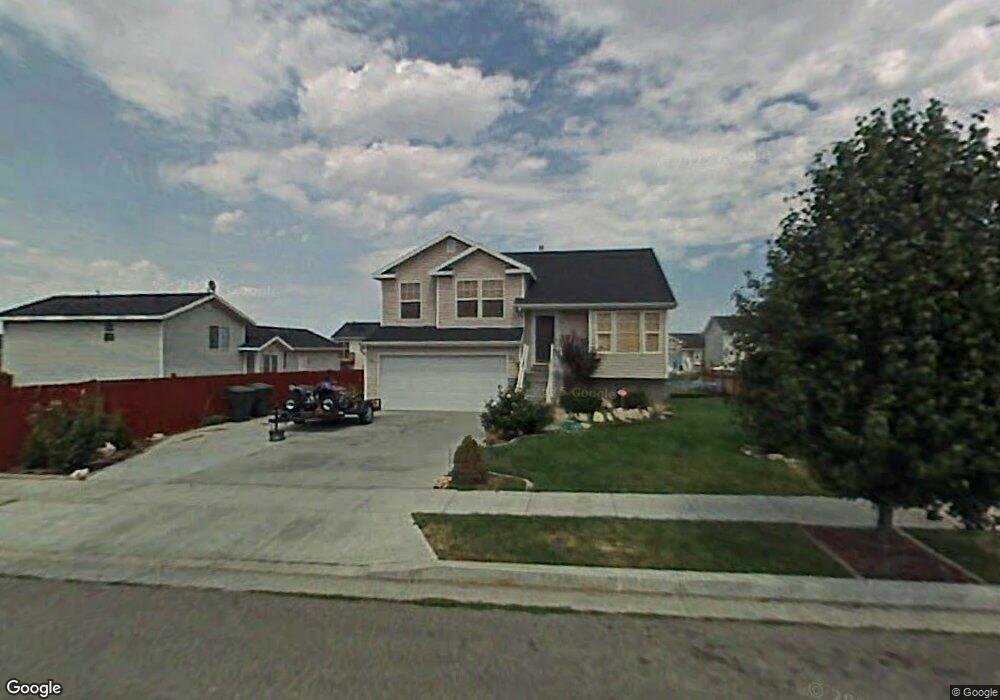
379 E 700 N Tooele, UT 84074
Estimated Value: $406,000 - $466,000
4
Beds
3
Baths
1,952
Sq Ft
$222/Sq Ft
Est. Value
About This Home
This home is located at 379 E 700 N, Tooele, UT 84074 and is currently estimated at $433,752, approximately $222 per square foot. 379 E 700 N is a home located in Tooele County with nearby schools including Sterling Elementary School, Tooele Junior High School, and Tooele High School.
Ownership History
Date
Name
Owned For
Owner Type
Purchase Details
Closed on
Mar 20, 2019
Sold by
Smith Anthony L and Smith Tiffany
Bought by
Mele Lemalu Sanele and Mele Lemalu
Current Estimated Value
Home Financials for this Owner
Home Financials are based on the most recent Mortgage that was taken out on this home.
Original Mortgage
$272,727
Outstanding Balance
$239,773
Interest Rate
4.4%
Mortgage Type
New Conventional
Estimated Equity
$193,979
Purchase Details
Closed on
Mar 26, 2007
Sold by
Smith Anthony L
Bought by
Smith Anthony L and Smith Tiffany
Home Financials for this Owner
Home Financials are based on the most recent Mortgage that was taken out on this home.
Original Mortgage
$161,100
Interest Rate
8.9%
Mortgage Type
Adjustable Rate Mortgage/ARM
Create a Home Valuation Report for This Property
The Home Valuation Report is an in-depth analysis detailing your home's value as well as a comparison with similar homes in the area
Purchase History
| Date | Buyer | Sale Price | Title Company |
|---|---|---|---|
| Mele Lemalu Sanele | -- | Metro National Title | |
| Smith Anthony L | -- | Chicago Title |
Source: Public Records
Mortgage History
| Date | Status | Borrower | Loan Amount |
|---|---|---|---|
| Open | Mele Lemalu Sanele | $272,727 | |
| Previous Owner | Smith Anthony L | $161,100 |
Source: Public Records
Tax History
| Year | Tax Paid | Tax Assessment Tax Assessment Total Assessment is a certain percentage of the fair market value that is determined by local assessors to be the total taxable value of land and additions on the property. | Land | Improvement |
|---|---|---|---|---|
| 2025 | $2,564 | $388,834 | $100,000 | $288,834 |
| 2024 | $2,793 | $213,201 | $55,000 | $158,201 |
| 2023 | $2,793 | $216,049 | $52,383 | $163,666 |
| 2022 | $2,379 | $204,641 | $51,906 | $152,735 |
| 2021 | $1,921 | $138,251 | $20,763 | $117,488 |
| 2020 | $1,830 | $228,478 | $37,750 | $190,728 |
| 2019 | $1,719 | $211,139 | $37,750 | $173,389 |
| 2018 | $1,606 | $186,940 | $40,000 | $146,940 |
| 2017 | $1,152 | $159,162 | $32,500 | $126,662 |
| 2016 | $960 | $78,453 | $17,875 | $60,578 |
| 2015 | $960 | $69,838 | $0 | $0 |
| 2014 | -- | $69,838 | $0 | $0 |
Source: Public Records
Map
Nearby Homes
Your Personal Tour Guide
Ask me questions while you tour the home.