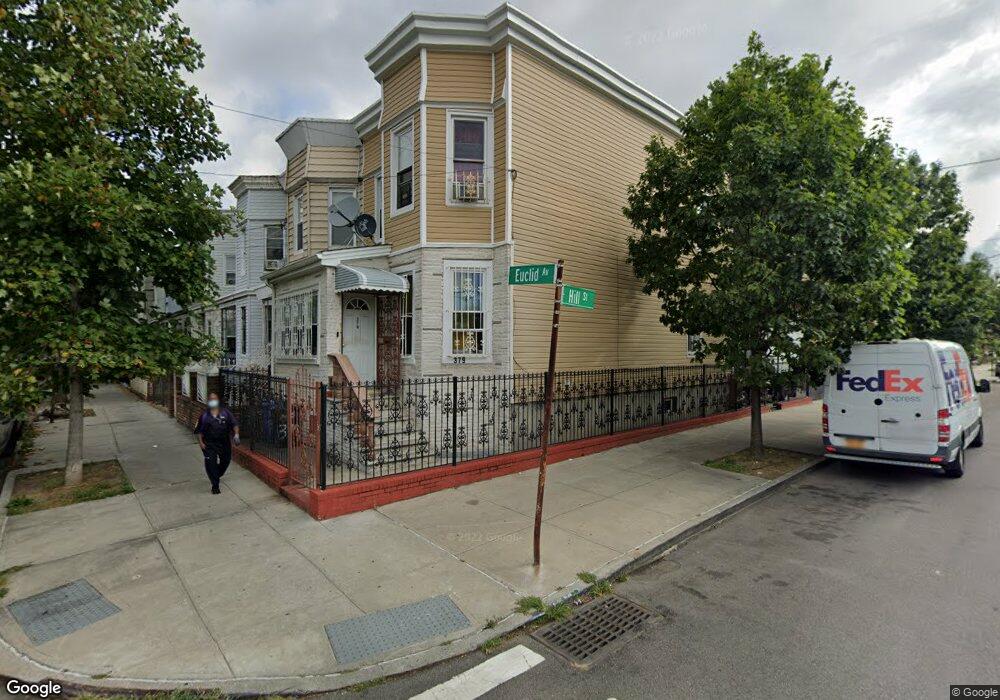
379 Euclid Ave Brooklyn, NY 11208
East New York NeighborhoodEstimated Value: $680,968 - $953,000
--
Bed
--
Bath
1,408
Sq Ft
$603/Sq Ft
Est. Value
About This Home
This home is located at 379 Euclid Ave, Brooklyn, NY 11208 and is currently estimated at $848,992, approximately $602 per square foot. 379 Euclid Ave is a home located in Kings County with nearby schools including P.S. 214 - Michael Friedsam, Cypress Hills Ascend Charter Lower School, and East Brooklyn Ascend.
Ownership History
Date
Name
Owned For
Owner Type
Purchase Details
Closed on
May 18, 2005
Sold by
Ulloa Reyes
Bought by
Bhagwandin Anna
Current Estimated Value
Home Financials for this Owner
Home Financials are based on the most recent Mortgage that was taken out on this home.
Original Mortgage
$312,800
Outstanding Balance
$162,991
Interest Rate
5.83%
Mortgage Type
Purchase Money Mortgage
Estimated Equity
$686,001
Purchase Details
Closed on
Jun 21, 2002
Sold by
Beltran Enid R
Bought by
Ulloa Reyes
Home Financials for this Owner
Home Financials are based on the most recent Mortgage that was taken out on this home.
Original Mortgage
$209,950
Interest Rate
6.73%
Purchase Details
Closed on
Jul 17, 1997
Sold by
Beltran Felix
Bought by
Beltran Enid R and Beltran Nereida
Home Financials for this Owner
Home Financials are based on the most recent Mortgage that was taken out on this home.
Original Mortgage
$160,000
Interest Rate
11.37%
Create a Home Valuation Report for This Property
The Home Valuation Report is an in-depth analysis detailing your home's value as well as a comparison with similar homes in the area
Home Values in the Area
Average Home Value in this Area
Purchase History
| Date | Buyer | Sale Price | Title Company |
|---|---|---|---|
| Bhagwandin Anna | $391,000 | -- | |
| Bhagwandin Anna | $391,000 | -- | |
| Ulloa Reyes | -- | -- | |
| Ulloa Reyes | -- | -- | |
| Beltran Enid R | $200,000 | -- | |
| Beltran Enid R | -- | -- |
Source: Public Records
Mortgage History
| Date | Status | Borrower | Loan Amount |
|---|---|---|---|
| Open | Bhagwandin Anna | $312,800 | |
| Closed | Bhagwandin Anna | $312,800 | |
| Previous Owner | Ulloa Reyes | $209,950 | |
| Previous Owner | Beltran Enid R | $160,000 |
Source: Public Records
Tax History Compared to Growth
Tax History
| Year | Tax Paid | Tax Assessment Tax Assessment Total Assessment is a certain percentage of the fair market value that is determined by local assessors to be the total taxable value of land and additions on the property. | Land | Improvement |
|---|---|---|---|---|
| 2025 | $5,008 | $47,340 | $11,640 | $35,700 |
| 2024 | $5,008 | $37,380 | $11,640 | $25,740 |
| 2023 | $4,780 | $44,580 | $11,640 | $32,940 |
| 2022 | $4,434 | $41,460 | $11,640 | $29,820 |
| 2021 | $4,410 | $33,420 | $11,640 | $21,780 |
| 2020 | $2,192 | $31,800 | $11,640 | $20,160 |
| 2019 | $4,347 | $31,800 | $11,640 | $20,160 |
| 2018 | $3,999 | $19,615 | $10,094 | $9,521 |
| 2017 | $3,773 | $18,511 | $8,978 | $9,533 |
| 2016 | $3,491 | $17,464 | $7,972 | $9,492 |
| 2015 | $1,886 | $17,464 | $10,251 | $7,213 |
| 2014 | $1,886 | $17,317 | $9,258 | $8,059 |
Source: Public Records
Map
Nearby Homes
- 400 Crescent St
- 393 Crescent St
- 19 Doscher St
- 371 Pine St
- 965 Glenmore Ave
- 74 Fountain Ave
- 92 Fountain Ave
- 3412 Atlantic Ave
- 200 Mckinley Ave
- 127 Crystal St
- 126 Crystal St
- 130 Crystal St
- 351 Autumn Ave
- 1103 Glenmore Ave
- 73 Milford St
- 294 Hemlock St
- 367 Lincoln Ave
- 404 Logan St
- 430 Pine St
- 90 Milford St