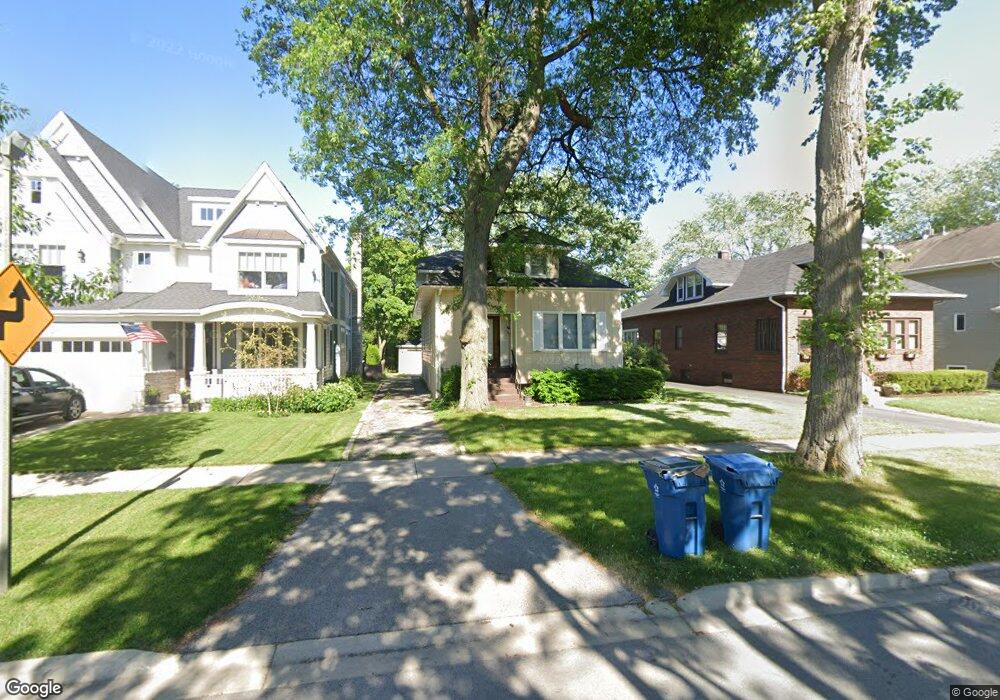
379 N Maple Ave Elmhurst, IL 60126
Estimated Value: $571,000 - $618,000
4
Beds
3
Baths
1,797
Sq Ft
$332/Sq Ft
Est. Value
About This Home
This home is located at 379 N Maple Ave, Elmhurst, IL 60126 and is currently estimated at $597,391, approximately $332 per square foot. 379 N Maple Ave is a home located in DuPage County with nearby schools including Emerson Elementary School, Churchville Middle School, and York Community High School.
Ownership History
Date
Name
Owned For
Owner Type
Purchase Details
Closed on
May 28, 2008
Sold by
Lopez Francisco and Kaysen Lopez Regina
Bought by
Monroe Caleb M and Cramer Venus C
Current Estimated Value
Home Financials for this Owner
Home Financials are based on the most recent Mortgage that was taken out on this home.
Original Mortgage
$337,487
Outstanding Balance
$215,232
Interest Rate
5.93%
Mortgage Type
FHA
Estimated Equity
$382,159
Purchase Details
Closed on
Mar 26, 2001
Sold by
Smith Jeffery A and Smith Maribeth
Bought by
Lopez Francisco and Kaysen Regina
Home Financials for this Owner
Home Financials are based on the most recent Mortgage that was taken out on this home.
Original Mortgage
$255,475
Interest Rate
7.02%
Mortgage Type
FHA
Purchase Details
Closed on
Jun 10, 1994
Sold by
Jeffery Harold R and Jeffery Doris B
Bought by
Smith Jeffery A and Smith Maribeth
Home Financials for this Owner
Home Financials are based on the most recent Mortgage that was taken out on this home.
Original Mortgage
$153,000
Interest Rate
8.78%
Mortgage Type
Purchase Money Mortgage
Create a Home Valuation Report for This Property
The Home Valuation Report is an in-depth analysis detailing your home's value as well as a comparison with similar homes in the area
Home Values in the Area
Average Home Value in this Area
Purchase History
| Date | Buyer | Sale Price | Title Company |
|---|---|---|---|
| Monroe Caleb M | $350,000 | Chicago Title Insurance Co | |
| Lopez Francisco | $259,500 | -- | |
| Smith Jeffery A | $255,000 | Law Title Insurance |
Source: Public Records
Mortgage History
| Date | Status | Borrower | Loan Amount |
|---|---|---|---|
| Open | Monroe Caleb M | $337,487 | |
| Previous Owner | Lopez Francisco | $255,475 | |
| Previous Owner | Smith Jeffery A | $153,000 |
Source: Public Records
Tax History
| Year | Tax Paid | Tax Assessment Tax Assessment Total Assessment is a certain percentage of the fair market value that is determined by local assessors to be the total taxable value of land and additions on the property. | Land | Improvement |
|---|---|---|---|---|
| 2024 | $8,593 | $148,322 | $70,816 | $77,506 |
| 2023 | $7,921 | $136,350 | $65,100 | $71,250 |
| 2022 | $7,615 | $130,310 | $62,300 | $68,010 |
| 2021 | $7,287 | $124,810 | $59,670 | $65,140 |
| 2020 | $6,854 | $119,540 | $57,150 | $62,390 |
| 2019 | $6,782 | $114,940 | $54,950 | $59,990 |
| 2018 | $6,421 | $108,530 | $52,340 | $56,190 |
| 2017 | $6,294 | $103,720 | $50,020 | $53,700 |
| 2016 | $6,025 | $95,760 | $46,180 | $49,580 |
| 2015 | $5,901 | $88,460 | $42,660 | $45,800 |
| 2014 | $5,490 | $76,510 | $35,200 | $41,310 |
| 2013 | $5,469 | $78,070 | $35,920 | $42,150 |
Source: Public Records
Map
Nearby Homes
- 270 W Fremont Ave
- 456 N Elm Ave
- 374 N Myrtle Ave
- 365 N Walnut St
- 275 W North Ave
- 260 N Addison Ave
- 258 N Addison Ave
- 256 N Addison Ave
- 254 N Addison Ave
- 367 N Oak St
- 142 W 3rd St
- 557 N Myrtle Ave
- 183 E Grantley Ave
- 210 N Addison Ave Unit 301N
- 195 N Addison Ave Unit PH03
- 132 E Gladys Ave
- 286 N Indiana St
- 322 N Highland Ave
- 284 N Highland Ave
- 234 E Grantley Ave
- 379 N Maple Ave Unit GARDEN
- 383 N Maple Ave
- 375 N Maple Ave
- 194 W Fremont Ave
- 186 W Fremont Ave
- 367 N Maple Ave
- 380 N Maple Ave
- 365 N Maple Ave
- 378 N Maple Ave
- 376 N Maple Ave
- 382 N Larch Ave
- 386 N Larch Ave
- 388 N Maple Ave
- 368 N Maple Ave
- 372 N Maple Ave
- 390 N Larch Ave
- 361 N Maple Ave
- 392 N Maple Ave
- 376 N Larch Ave
- 374 N Larch Ave
Your Personal Tour Guide
Ask me questions while you tour the home.