Estimated Value: $507,075 - $543,000
3
Beds
2
Baths
1,440
Sq Ft
$362/Sq Ft
Est. Value
About This Home
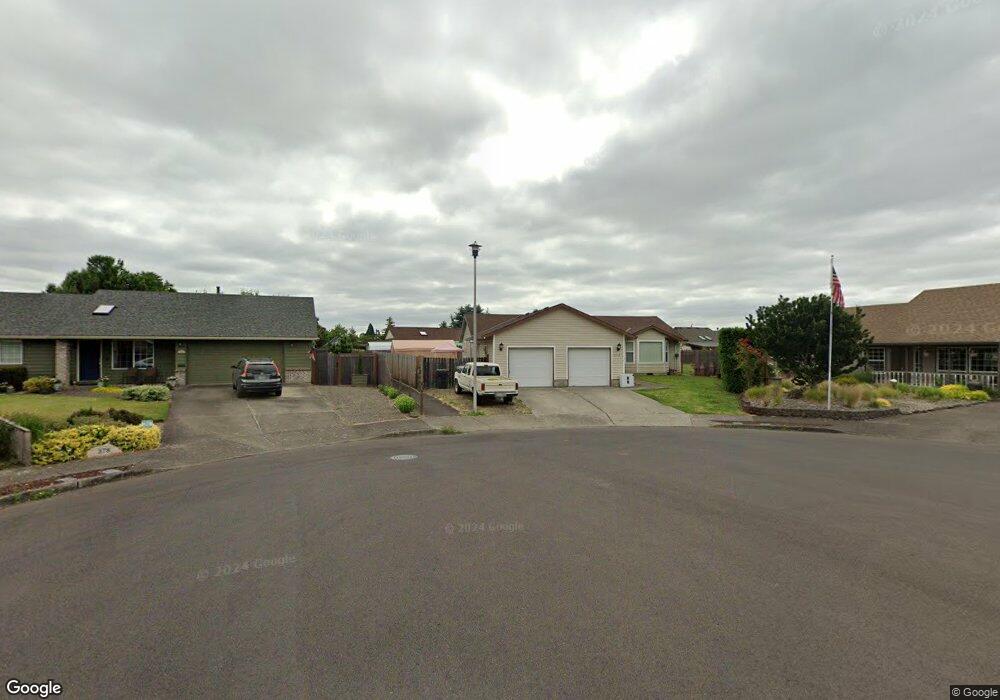
This home is located at 379 SE 7th Way, Canby, OR 97013 and is currently estimated at $521,769, approximately $362 per square foot. 379 SE 7th Way is a home located in Clackamas County with nearby schools including Josefa L. Sambrano Elementary School, Philander Lee Elementary School, and Baker Prairie Middle School.
Ownership History
Date
Name
Owned For
Owner Type
Purchase Details
Closed on
Nov 12, 2009
Sold by
Skiffington Michael and Skiffington Linnea
Bought by
Brandhorst William Frank and Brandhorst Daisy M
Current Estimated Value
Home Financials for this Owner
Home Financials are based on the most recent Mortgage that was taken out on this home.
Original Mortgage
$250,000
Outstanding Balance
$161,150
Interest Rate
4.83%
Mortgage Type
New Conventional
Estimated Equity
$360,619
Purchase Details
Closed on
Oct 24, 2007
Sold by
Keller Harry
Bought by
Skiffington Michael and Skiffington Linnea
Home Financials for this Owner
Home Financials are based on the most recent Mortgage that was taken out on this home.
Original Mortgage
$190,000
Interest Rate
6.27%
Mortgage Type
Purchase Money Mortgage
Purchase Details
Closed on
Apr 29, 2002
Sold by
Keller Harry
Bought by
Skiffington Michael and Skiffington Linnea
Purchase Details
Closed on
Sep 26, 1996
Sold by
Eiche Greg and Aitken Sarah E
Bought by
Parr Lorraine J and Scavarda Theresa
Create a Home Valuation Report for This Property
The Home Valuation Report is an in-depth analysis detailing your home's value as well as a comparison with similar homes in the area
Home Values in the Area
Average Home Value in this Area
Purchase History
| Date | Buyer | Sale Price | Title Company |
|---|---|---|---|
| Brandhorst William Frank | $245,000 | First American Title Insuran | |
| Skiffington Michael | $126,800 | Chicago Title Insurance Co | |
| Skiffington Michael | $126,800 | Chicago Title Insurance Comp | |
| Parr Lorraine J | $138,000 | Stewart Title |
Source: Public Records
Mortgage History
| Date | Status | Borrower | Loan Amount |
|---|---|---|---|
| Open | Brandhorst William Frank | $250,000 | |
| Previous Owner | Skiffington Michael | $190,000 | |
| Closed | Skiffington Michael | $0 |
Source: Public Records
Tax History Compared to Growth
Tax History
| Year | Tax Paid | Tax Assessment Tax Assessment Total Assessment is a certain percentage of the fair market value that is determined by local assessors to be the total taxable value of land and additions on the property. | Land | Improvement |
|---|---|---|---|---|
| 2025 | $5,120 | $289,001 | -- | -- |
| 2024 | $4,977 | $280,584 | -- | -- |
| 2023 | $4,977 | $272,412 | $0 | $0 |
| 2022 | $4,577 | $264,478 | $0 | $0 |
| 2021 | $4,408 | $256,775 | $0 | $0 |
| 2020 | $4,329 | $249,297 | $0 | $0 |
| 2019 | $4,122 | $242,036 | $0 | $0 |
| 2018 | $4,030 | $234,986 | $0 | $0 |
| 2017 | $3,928 | $228,142 | $0 | $0 |
| 2016 | $3,797 | $221,497 | $0 | $0 |
| 2015 | $3,667 | $215,046 | $0 | $0 |
| 2014 | $3,561 | $208,783 | $0 | $0 |
Source: Public Records
Map
Nearby Homes
- 363 SE 7th Ave
- 387 SE 7th Ave
- 423 SE 7th Ave
- 385 SE Township Rd
- 331 SE 9th Ave
- 486 S Knott St
- 582 S Maple St
- 248 SE Township Rd
- 574 S Ivy St
- 550 SE 5th Ave
- 575 S Ponderosa St
- 481 S Holly St
- 620 SE 2nd Ave
- 620 SE 2nd Ave Unit 11
- 1111 SE 3rd Ave Unit 74
- 299 SW 3rd Ave
- 1460 SE 9th Ave
- 201 SE 16th Ave
- 835 SE 1st Ave Unit 64
- 835 SE 1st Ave Unit 14
- 365 SE 7th Way
- 719 S Lupine St
- 759 S Lupine St
- 378 SE 7th Way
- 679 S Lupine St
- 384 SE 7th Ave
- 376 SE 7th Ave
- 351 SE 7th Way
- 761 S Lupine St
- 366 SE 7th Way
- 362 SE 7th Ave
- 639 S Lupine St
- 356 SE 7th Way
- 726 S Lupine St
- 354 SE 7th Ave
- 341 SE 7th Way
- 441 SE Township Rd
- 609 S Lupine St
- 510 SE 7th Place
- 406 SE 7th Ave