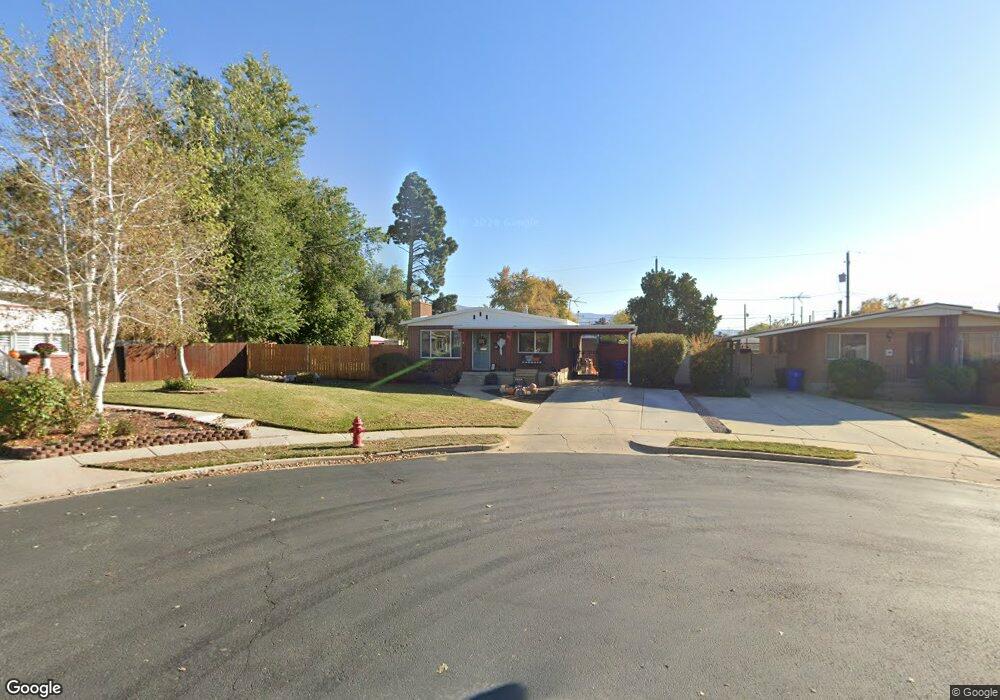
379 W 200 S Bountiful, UT 84010
Estimated Value: $455,000 - $518,000
4
Beds
3
Baths
2,072
Sq Ft
$241/Sq Ft
Est. Value
About This Home
This home is located at 379 W 200 S, Bountiful, UT 84010 and is currently estimated at $499,431, approximately $241 per square foot. 379 W 200 S is a home located in Davis County with nearby schools including Meadowbrook Elementary School, Bountiful Junior High School, and Bountiful High School.
Ownership History
Date
Name
Owned For
Owner Type
Purchase Details
Closed on
Apr 12, 2018
Sold by
Anderson Skyler K and Anderson Kimberly S
Bought by
Allred Justin J and Allred Sarah R
Current Estimated Value
Purchase Details
Closed on
Dec 29, 2010
Sold by
Vantussenbrook Terrol
Bought by
Anderson Skyler K and Anderson Kimberly S
Home Financials for this Owner
Home Financials are based on the most recent Mortgage that was taken out on this home.
Original Mortgage
$146,197
Interest Rate
4.37%
Mortgage Type
FHA
Purchase Details
Closed on
Jun 16, 2000
Sold by
Vantussenbrook Carol O
Bought by
Vantussenbrook Carol
Create a Home Valuation Report for This Property
The Home Valuation Report is an in-depth analysis detailing your home's value as well as a comparison with similar homes in the area
Purchase History
| Date | Buyer | Sale Price | Title Company |
|---|---|---|---|
| Allred Justin J | -- | Stewart Title | |
| Anderson Skyler K | -- | Inwest Title Services In | |
| Vantussenbrook Carol | -- | -- |
Source: Public Records
Mortgage History
| Date | Status | Borrower | Loan Amount |
|---|---|---|---|
| Previous Owner | Anderson Skyler K | $146,197 |
Source: Public Records
Tax History
| Year | Tax Paid | Tax Assessment Tax Assessment Total Assessment is a certain percentage of the fair market value that is determined by local assessors to be the total taxable value of land and additions on the property. | Land | Improvement |
|---|---|---|---|---|
| 2025 | $2,862 | $247,500 | $167,969 | $79,531 |
| 2024 | $2,666 | $239,800 | $159,866 | $79,934 |
| 2023 | $2,561 | $419,000 | $284,891 | $134,109 |
| 2022 | $2,553 | $228,800 | $153,143 | $75,657 |
| 2021 | $2,359 | $325,000 | $200,804 | $124,196 |
| 2020 | $2,103 | $289,000 | $168,153 | $120,847 |
| 2019 | $2,134 | $287,000 | $156,231 | $130,769 |
| 2018 | $1,839 | $239,729 | $145,417 | $94,312 |
| 2016 | $1,486 | $103,730 | $66,527 | $37,203 |
| 2015 | $1,534 | $101,805 | $66,527 | $35,278 |
| 2014 | $1,571 | $108,378 | $66,527 | $41,851 |
| 2013 | -- | $93,702 | $39,266 | $54,436 |
Source: Public Records
Map
Nearby Homes
- 75 N Peregrine Ln W Unit 8
- 449 W 200 N Unit 3
- 290 N 500 W Unit 108
- 290 N 500 W Unit 305
- 399 W 400 N Unit 47
- 332 N 300 W
- 401 W 400 N Unit 49
- 376 W 800 S
- 403 W 400 N Unit 1
- 320 N 200 W Unit 4
- 32 W 400 S
- 34 W 400 S
- 650 S Main St Unit 6206
- 650 S Main St Unit 9106
- 990 S 500 W
- 499 N 200 W Unit 30
- 1016 S 400 W
- 252 N Main St
- 254 N Main St
- 256 N Main St
Your Personal Tour Guide
Ask me questions while you tour the home.